Bubble Chart
- 4 minutes to read
Short Description
The Bubble Chart is represented by the BubbleSeriesView object, which belongs to Point Series Views. In addition to other point diagram capabilities, this view allows you to visually represent data that has a third dimension (the BubbleLabelValueToDisplay.Weight of a series point), expressed in a bubble’s size. You can map two dimensions along the usual X and Y axes, and then the third dimension is displayed as a shape (a filled circle - “bubble”, a star, a triangle, etc.) at the data point. Also, you can use the BubbleSeriesView.MaxSize and BubbleSeriesView.MinSize properties of the series view to specify the size of the smallest and largest marker for the chart.
A Bubble chart example is shown in the image below. Note that this chart type is based upon the XYDiagram, so it can be rotated to change axis positions.
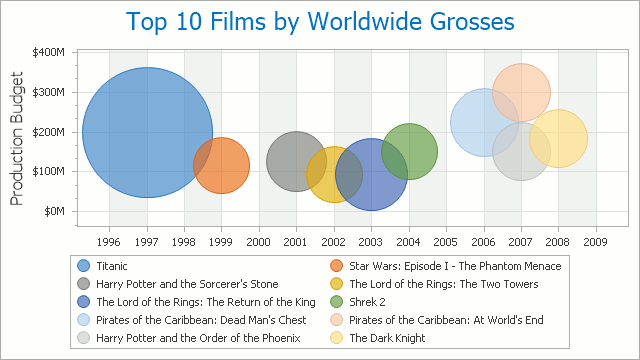
Chart Type Characteristics
The table below lists the main characteristics of this chart type.
| Feature | Value |
|---|---|
| Series View type | BubbleSeriesView |
| Diagram type | 2D-XYDiagram |
| Number of arguments per series point | 1 |
| Number of values per series point | 2 (Value and Weight) |
Note
For information on chart types that can be combined with the Bubble Chart, refer to the following help topic: Series Views Compatibility.
Example
The following example creates a ChartControl with two series of the BubbleSeriesView type, and adds this chart to a form at runtime. Before proceeding with this example, create a Windows Forms Application in Visual Studio, and add all required assemblies to the project’s References list.
Then, add the following code to the Form.Load event handler.
using System;
using System.Windows.Forms;
using DevExpress.XtraCharts;
// ...

namespace Series_BubbleChart {
    public partial class Form1 : Form {
        public Form1() {
            InitializeComponent();
        }

        private void Form1_Load(object sender, EventArgs e) {
            // Create a new chart.
            ChartControl bubbleChart = new ChartControl();

            // Create two bubble series.
            Series series1 = new Series("Series 1", ViewType.Bubble);
            Series series2 = new Series("Series 2", ViewType.Bubble);

            // Add points to them.
            series1.Points.Add(new SeriesPoint(1, 11, 2));
            series1.Points.Add(new SeriesPoint(2, 10, 1));
            series1.Points.Add(new SeriesPoint(3, 14, 3));
            series1.Points.Add(new SeriesPoint(4, 17, 2));

            series2.Points.Add(new SeriesPoint(1, 15, 3));
            series2.Points.Add(new SeriesPoint(2, 18, 4));
            series2.Points.Add(new SeriesPoint(3, 25, 2));
            series2.Points.Add(new SeriesPoint(4, 33, 1));

            // Add both series to the chart.
            bubbleChart.Series.AddRange(new Series[] { series1, series2 });

            // Set the numerical argument scale types for the series,
            // as it is qualitative, by default.
            series1.ArgumentScaleType = ScaleType.Numerical;
            series2.ArgumentScaleType = ScaleType.Numerical;

            // Access the view-type-specific options of the series.
            ((BubbleSeriesView)series1.View).AutoSize = false;
            ((BubbleSeriesView)series1.View).MaxSize = 1;
            ((BubbleSeriesView)series1.View).MinSize = 0.3;
            ((BubbleSeriesView)series1.View).BubbleMarkerOptions.Kind = MarkerKind.Circle;

            // Access the type-specific options of the diagram.
            ((XYDiagram)bubbleChart.Diagram).Rotated = true;

            // Hide the legend (if necessary).
            bubbleChart.Legend.Visibility = DevExpress.Utils.DefaultBoolean.False;

            // Add a chart to the form.
            bubbleChart.Dock = DockStyle.Fill;
            this.Controls.Add(bubbleChart);
        }
    }
}
Tip
For the complete sample project, see the following DevExpress Support Center example: https://supportcenter.devexpress.com/ticket/details/e904/chart-control-for-winforms-how-to-create-a-bubble-chart.