ChartControl Class
Visualizes data as bars, areas, lines and other shapes. See Chart Control.
Namespace: DevExpress.XtraCharts
Assembly: DevExpress.XtraCharts.v20.2.UI.dll
NuGet Package: DevExpress.Win.Charts
Declaration
[SerializationContext(typeof(ChartSerializationContext))]
public class ChartControl :
    Control,
    IChartContainerEx,
    IChartContainer,
    IChartRenderProvider,
    IChartDataProvider,
    IChartEventsProvider,
    IChartInteractionProvider,
    IPrintable,
    IBasePrintable,
    IChartAnimationProvider,
    ISupportInitialize,
    ICloneable,
    ICoreReference,
    IGestureClient,
    IToolTipControlClient,
    IRangeControlClientExtension,
    IRangeControlClient,
    ISupportLookAndFeel,
    IAnyControlEdit2,
    IAnyControlEdit,
    ICustomBindingPropertiesProvider,
    IFilteringUIClient,
    IFilterCriteriaBindingAware,
    IDirectXClient,
    IXtraSerializable,
    ISupportBarsInteraction,
    IServiceProvider,
    ICommandAwareControl<ChartCommandId>,
ICursorHolderRemarks
The ChartControl class is a visual control used to display assorted data graphically. It visualizes the Series of Points using one of the available View Types. The currently used View Type is accessed via the SeriesBase.View property. Note that at the same time, a chart can draw multiple series using different View Types.
A chart control contains multiple visual elements (diagram, axes, titles, labels, strips, constant lines, etc.), these aren’t a Component, but can be selected at design time. Note that when any of these elements are selected, the Properties Window in the IDE is filtered and shows only the properties which correspond to the selected item. To enable these elements to be selected at runtime, set the ChartControl.RuntimeSelection property to true.
The ChartControl allows not only series data to be visualized on screen, but also to print and export it to various data formats (PDF, HTML, BMP, etc.). Note that export to image (called via ChartControl.ExportToImage method) is implemented internally in XtraCharts, and to enable other export formats, the XtraPrinting Library should be used. The XtraPrinting Library is not shipped with XtraCharts and should be installed separately. To check if the required XtraPrinting assemblies are available, use the ChartControl.IsPrintingAvailable method.
There are two possible ways to provide data for visualization within the ChartControl. You can either bind each series separately or the entire chart to data. Note that in both cases, you first need to create a data source (any object which implements either IList, IListSource or IBindingList interfaces), and then assign it to the ChartControl.DataSource property. If you want the DataSource to be automatically filled by the ChartControl at design and runtime, you need to specify its ChartControl.DataAdapter property, otherwise you will need to manually populate the datasource.
Then, do one of the following:
- Series Binding. To do this, you should first create one or several series and add it to the chart’s ChartControl.Series collection, and then specify which data fields should be used as points arguments (SeriesBase.ArgumentDataMember) and which should be used as points values (SeriesBase.ValueDataMembers). Note that if you want to specify different data sources for each series, you should specify each of the data sources to the Series.DataSource property of each series.
- Chart Binding. The second method of data binding is useful when series names are stored within all the other series data in a data source, and all series should be generated automatically. To do this, you first need to specify the data field used to provide names for the generated series to the ChartControl.SeriesDataMember property. After that, it’s necessary to specify the data fields used for series points arguments and values to the SeriesBase.ArgumentDataMember and SeriesBase.ValueDataMembers properties of the SeriesBase object returned by the ChartControl.SeriesTemplate property.
Note
The ChartControl control is intended to be used in Windows® Forms applications only. If you need to add charting ability to your ASP.NET application, use the WebChartControl instead.
Examples
How to Bind the Chart Control to a List of Objects
The following example creates a ChartControl at runtime and shows how to perform basic customization tasks:
- Add a series to a chart.
- Bind the series to a data source.
- Enable series markers.
- Display series labels and format their text.
- Add a chart title.
- Configure axis parameters (label format and grid spacing).
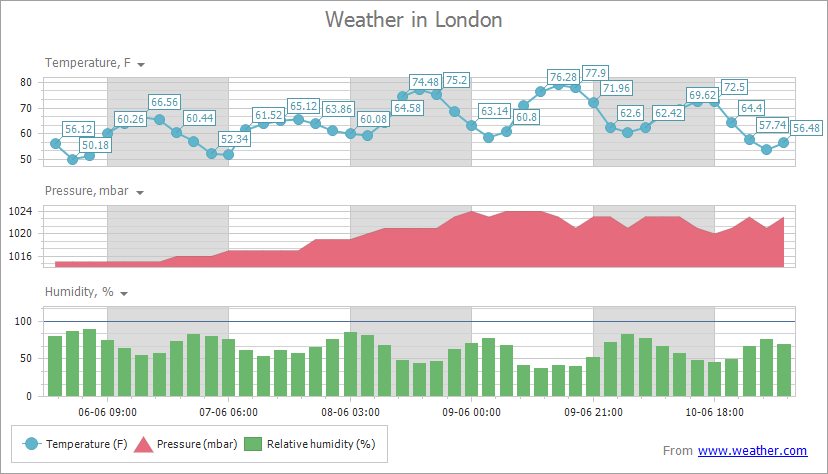
The image below shows the resulting chart:

Note
To add a Chart Control to a form at runtime, ensure that you include all necessary assemblies to the References list of your project.
using DevExpress.XtraCharts;
using System;
using System.Collections.Generic;
using System.Windows.Forms;

namespace ChartSample {
    public partial class Form1 : Form {
        public Form1() {
            InitializeComponent();
        }
        private void Form1_Load(object sender, EventArgs e) {
            // Create a Chart Control object and add it to the form.
            ChartControl chart = new ChartControl();
            chart.Dock = DockStyle.Fill;
            this.Controls.Add(chart);

            // Create a line series, bind it to data and add to the chart.
            Series series = new Series("Temperature", ViewType.Line);
            series.DataSource = DataPoint.GetDataPoints();
            series.ArgumentDataMember = "Date";
            series.ValueDataMembers.AddRange("Value");
            chart.Series.Add(series);

            // Enable series markers.
            LineSeriesView view = (LineSeriesView)series.View;
            view.MarkerVisibility = DevExpress.Utils.DefaultBoolean.True;

            // Display series labels and customize their text format.
            series.LabelsVisibility = DevExpress.Utils.DefaultBoolean.True;
            series.Label.ResolveOverlappingMode = ResolveOverlappingMode.HideOverlapped;
            series.Label.TextPattern = "{V:.#}";

            // Create a chart title.
            ChartTitle chartTitle = new ChartTitle();
            chartTitle.Text = "Temperature (°F)";
            chart.Titles.Add(chartTitle);

            // Customize axes.
            XYDiagram diagram = chart.Diagram as XYDiagram;
            diagram.AxisX.Label.TextPattern = "{A:MMM, d (HH:mm)}";
            diagram.AxisX.DateTimeScaleOptions.MeasureUnit = DateTimeMeasureUnit.Hour;
            diagram.AxisX.DateTimeScaleOptions.GridSpacing = 9;
            diagram.AxisX.WholeRange.SideMarginsValue = 0.5;
            diagram.AxisY.WholeRange.AlwaysShowZeroLevel = false;

            // Hide a legend if necessary.
            chart.Legend.Visibility = DevExpress.Utils.DefaultBoolean.False;
        }

        public class DataPoint {
            public DateTime Date { get; set; }
            public double Value { get; set; }
            public DataPoint(DateTime date, double value) {
                this.Date = date;
                this.Value = value;
            }
            public static List<DataPoint> GetDataPoints() {
                List<DataPoint> data = new List<DataPoint> {
                new DataPoint(new DateTime(2019, 6, 1, 0, 0, 0), 56.1226),
                new DataPoint(new DateTime(2019, 6, 1, 3, 0, 0), 50.18432),
                new DataPoint(new DateTime(2019, 6, 1, 6, 0, 0), 51.51443),
                new DataPoint(new DateTime(2019, 6, 1, 9, 0, 0), 60.2624),
                new DataPoint(new DateTime(2019, 6, 1, 12, 0, 0), 64.04412),
                new DataPoint(new DateTime(2019, 6, 1, 15, 0, 0), 66.56123),
                new DataPoint(new DateTime(2019, 6, 1, 18, 0, 0), 65.48127),
                new DataPoint(new DateTime(2019, 6, 1, 21, 0, 0), 60.4412),
                new DataPoint(new DateTime(2019, 6, 2, 0, 0, 0), 57.2341),
                new DataPoint(new DateTime(2019, 6, 2, 3, 0, 0), 52.3469),
                new DataPoint(new DateTime(2019, 6, 2, 6, 0, 0), 51.82341),
                new DataPoint(new DateTime(2019, 6, 2, 9, 0, 0), 61.532),
                new DataPoint(new DateTime(2019, 6, 2, 12, 0, 0), 63.8641),
                new DataPoint(new DateTime(2019, 6, 2, 15, 0, 0), 65.12374),
                new DataPoint(new DateTime(2019, 6, 2, 18, 0, 0), 65.6321)};
                return data;
            }
        }
    }
}
How to Manually Add Points to a Series
The following example demonstrates how to create a ChartControl with two series of the SideBySideBarSeriesView type, and add this chart to a form at runtime. Before proceeding with this example, first create a Windows Forms Application in Visual Studio, and include all necessary assemblies to the References list of your project.
Then, add the following code to the Form.Load event handler.
using System;
using System.Windows.Forms;
using DevExpress.XtraCharts;
// ...

namespace SideBySideBar2D {
    public partial class Form1 : Form {
        public Form1() {
            InitializeComponent();
        }

        private void Form1_Load(object sender, EventArgs e) {
            // Create an empty chart.
            ChartControl sideBySideBarChart = new ChartControl();

            // Create the first side-by-side bar series and add points to it.
            Series series1 = new Series("Side-by-Side Bar Series 1", ViewType.Bar);
            series1.Points.Add(new SeriesPoint("A",  10));
            series1.Points.Add(new SeriesPoint("B", 12));
            series1.Points.Add(new SeriesPoint("C", 14));
            series1.Points.Add(new SeriesPoint("D", 17));

            // Create the second side-by-side bar series and add points to it.
            Series series2 = new Series("Side-by-Side Bar Series 2", ViewType.Bar);
            series2.Points.Add(new SeriesPoint("A", 15));
            series2.Points.Add(new SeriesPoint("B", 18));
            series2.Points.Add(new SeriesPoint("C", 25));
            series2.Points.Add(new SeriesPoint("D", 33));

            // Add the series to the chart.
            sideBySideBarChart.Series.Add(series1);
            sideBySideBarChart.Series.Add(series2);

            // Hide the legend (if necessary).
            sideBySideBarChart.Legend.Visibility = DevExpress.Utils.DefaultBoolean.False;

            // Rotate the diagram (if necessary).
            ((XYDiagram)sideBySideBarChart.Diagram).Rotated = true;

            // Add a title to the chart (if necessary).
            ChartTitle chartTitle1 = new ChartTitle();
            chartTitle1.Text = "Side-by-Side Bar Chart";
            sideBySideBarChart.Titles.Add(chartTitle1);

            // Add the chart to the form.
            sideBySideBarChart.Dock = DockStyle.Fill;
            this.Controls.Add(sideBySideBarChart);
        }

    }
}