Pivot Table
- 2 minutes to read
This document introduces the Pivot Table functionality, which allows you to perform complex analysis of raw data in a worksheet using pivot tables.
A pivot table represents a summary table used to explore, analyze and aggregate huge amounts of data in a worksheet. It allows you to divide your data into categories and subcategories, and automatically calculates subtotals and grand totals using the most suitable summary function from a predefined list. For example, the image gallery below shows a table with raw data and a PivotTable report built based on this table.

Source Data
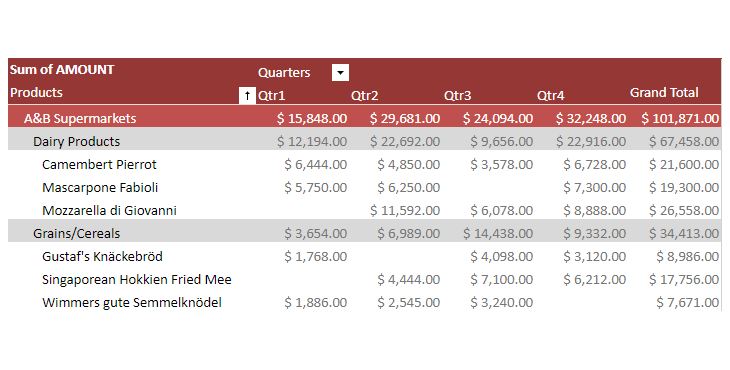
PivotTable Report
Manage Pivot Tables in the User Interface
Insert a Pivot Table
End-users can create a pivot table using the Create PivotTable Dialog dialog, which can be invoked by clicking the PivotTable button on the Insert tab, in the Tables group.

Organize the PivotTable Structure
End-users can use the Field List pane to add fields to the pivot table and arrange them as required using drag and drop.

Adjust the PivotTable Options
After end-users create a pivot table and lay out its fields, they can fine-tune their report using various commands located on the Analyze and Design contextual tabs, which appears when any cell in the pivot table is selected.

Options on the Analyze tab allow end-users to change the underlying settings of a pivot table. They can specify various options affecting the table layout, select the aggregate function used to summarize values in the data field, change the data source for the report, refresh the pivot table, change its location, display or hide the Field List, etc.
The Design contextual tab provides a wide range of formatting options enabling end-users to change the pivot table appearance. In particular, end-users can adjust the report layout by displaying the pivot table in compact, outline, or tabular form, show or hide subtotals and grand totals, and configure style options.

Explore the PivotTable Data
After a pivot table is completely organized and adjusted, end-users can easily explore the resulting report: sort field items and apply a filter to the pivot table to display only significant values.