IVectorMapsPieMarker Interface
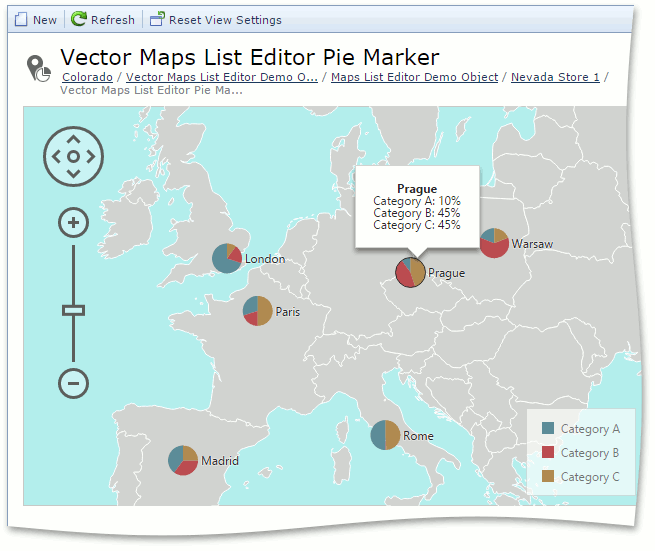
Declares properties of business objects that can be displayed as a pie chart marker on a vector map using the Maps Module.
Namespace: DevExpress.Persistent.Base
Assembly: DevExpress.Persistent.Base.v24.1.dll
NuGet Package: DevExpress.Persistent.Base
Declaration
Remarks
You can implement this interface in an XPO or Entity Framework business object. As a result, the WebVectorMapsListEditor will be used to display List Views of this business object. Each object is displayed as a pie chart marker. An object’s Detail View is displayed after clicking a marker. The sizes of pie chart slices are specified using the IVectorMapsPieMarker.Values property.

XPO Example
using DevExpress.Xpo;
using DevExpress.Persistent.Base;
using DevExpress.Persistent.BaseImpl;
// ...
[DefaultClassOptions, DefaultProperty(nameof(Title))]
public class VectorMapsListEditorPieMarker : BaseObject, IVectorMapsPieMarker {
    public VectorMapsListEditorPieMarker(Session session) : base(session) { }
    public string Title { get; set; }
    [Browsable(false)]
    public string Tooltip {
        get {
            string valuesStr = "";
            string[] captions = { "Category A", "Category B", "Category C" };
            float[] values = { CategoryAPercentage, CategoryBPercentage, CategoryCPercentage };
            int index = 0;
            foreach(float value in values) {
                if(index != 0)
                    valuesStr += "<br>";
                if(index >= captions.Length)
                    index = captions.Length - 1;
                valuesStr += string.Format("{0}: {1}%", captions[index++], value);
            }
            return string.Format("<b>{0}</b><br>{1}", Title, valuesStr);
        }
    }
    public double Latitude { get; set; }
    public double Longitude { get; set; }
    [Browsable(false)]
    public IList<float> Values {
        get {
            return new List<float> { CategoryAPercentage, CategoryBPercentage, CategoryCPercentage };
        }
    }
    [DevExpress.Xpo.DisplayName("Category A percentage")]
    public float CategoryAPercentage { get; set; }
    [DevExpress.Xpo.DisplayName("Category B percentage")]
    public float CategoryBPercentage { get; set; }
    [DevExpress.Xpo.DisplayName("Category C percentage")]
    public float CategoryCPercentage { get; set; }
}
Note
See the complete example in the VectorMapsListEditorDemoObject.cs file in the Feature Center demo that is installed in the %PUBLIC%\Documents\DevExpress Demos 24.1\Components\XAF\FeatureCenter.NETFramework.XPO folder by default, or refer to the Feature Center demo online.
EF Example
using DevExpress.Persistent.Base;
// ...
[DefaultClassOptions, DefaultProperty(nameof(Title))]
public class VectorMapsListEditorPieMarker, IVectorMapsPieMarker {
    public int ID { get; private set; }
    public string Title { get; set; }
    [Browsable(false)]
    public string Tooltip {
        get {
            string valuesStr = "";
            string[] captions = { "Category A", "Category B", "Category C" };
            float[] values = { CategoryAPercentage, CategoryBPercentage, CategoryCPercentage };
            int index = 0;
            foreach(float value in values) {
                if(index != 0)
                    valuesStr += "<br>";
                if(index >= captions.Length)
                    index = captions.Length - 1;
                valuesStr += string.Format("{0}: {1}%", captions[index++], value);
            }
            return string.Format("<b>{0}</b><br>{1}", Title, valuesStr);
        }
    }
    public double Latitude { get; set; }
    public double Longitude { get; set; }
    [Browsable(false)]
    public IList<float> Values {
        get {
            return new List<float> { CategoryAPercentage, CategoryBPercentage, CategoryCPercentage };
        }
    }
    [DevExpress.Xpo.DisplayName("Category A percentage")]
    public float CategoryAPercentage { get; set; }
    [DevExpress.Xpo.DisplayName("Category B percentage")]
    public float CategoryBPercentage { get; set; }
    [DevExpress.Xpo.DisplayName("Category C percentage")]
    public float CategoryCPercentage { get; set; }
}