Creating a Table Report
- 4 minutes to read
This tutorial describes how to create a data-bound report displaying information in a tabular format. Table reports should not be confused with hierarchical master-detail reports, nor with cross-tab reports.
Tip
To get started with this tutorial, open an existing reporting application or create a new one from scratch. To learn how to create a reporting application on the platform of your choice, see Adding a Report to Your .NET Application.
This topic consists of the following sections:
Create a Table Report at Design Time
- To create a table report in this tutorial, start with a report that is bound to the “Products” table of the sample Northwind database (the nwind.mdb file included in the XtraReports installation). To learn more about binding a report to a data source, see Providing Data to Reports.
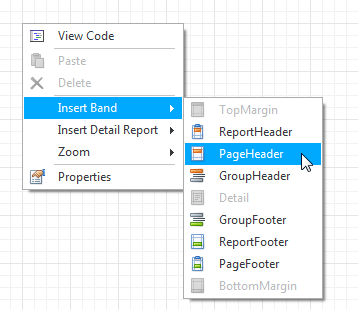
To print the column headers at the top of every document page, add a Page Header band to the report. To do this, right-click the report’s surface, and select Insert Band | PageHeader in the context menu that is invoked.
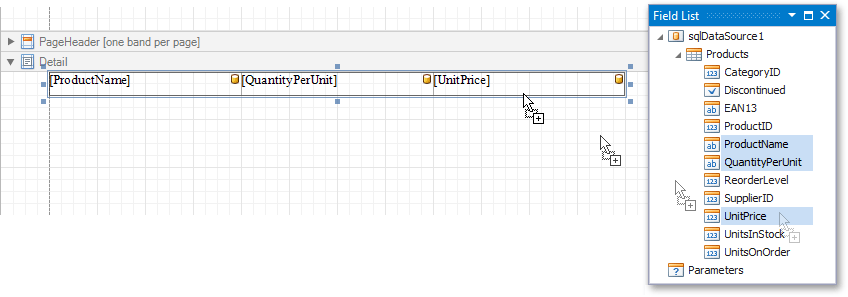
To quickly create column headers, switch to the Field List and select the required fields by clicking them while holding the CTRL or SHIFT key. Then drag-and-drop them onto the PageHeader band with the right mouse button.
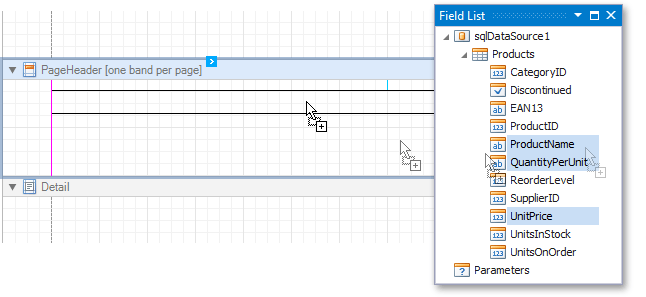
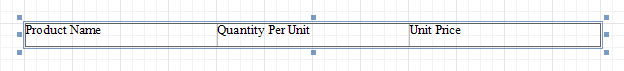
This will create an XRTable in which each XRTableCell shows a field name. (If “camel case” is detected in a field name, it is converted to its common spelling that uses white spaces.)
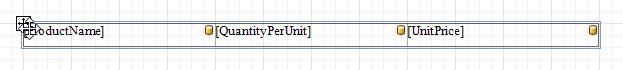
To provide dynamic content to the report, switch to the Field List again and select the same fields. Click the selected fields (while holding the CTRL or SHIFT key) and drag-and-drop them onto the Detail band.
This will create a table with the same number of cells as the number of fields selected, with each cell bound to the appropriate data field.
To select a table, click its handle, which appears when you hover the table with the mouse cursor. To select both tables simultaneously, click their handles while holding the CTRL key.
Next, press F4 to switch to the Properties window and customize common options of both tables at one time. (For example, set the Padding, Borders and BorderColor properties.)
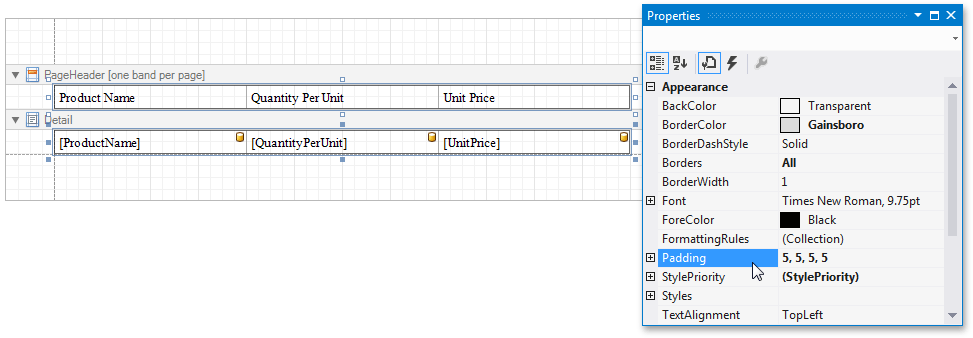
To define the background color and customize text appearance, use the formatting toolbar.

To define a currency format for the UnitPrice cell, select the cell and click its mart tag. Then click the ellipsis button for the Format String property in the actions list that is invoked. Select the appropriate format in the FormatString editor that is invoked and click OK.
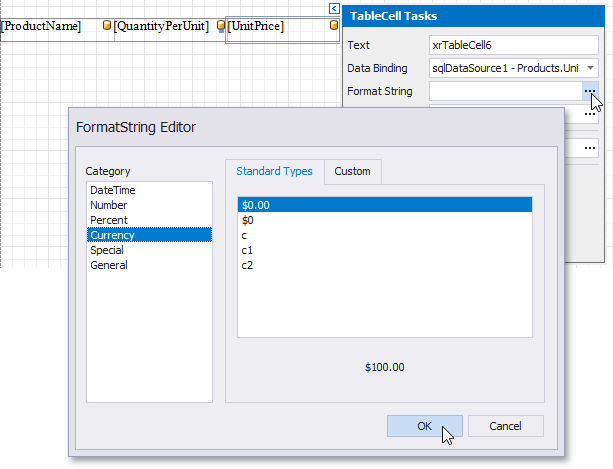
Right-align the cell’s content to improve readability by setting its TextAlignment property to TopRight.
To further improve the readability of the table, you can apply different visual styles to its odd and even rows. To learn more, see Report Visual Styles.
To learn how to add or remove the table’s rows and cells, as well as convert the table’s cells to separate XRLabel controls, see the Table topic.
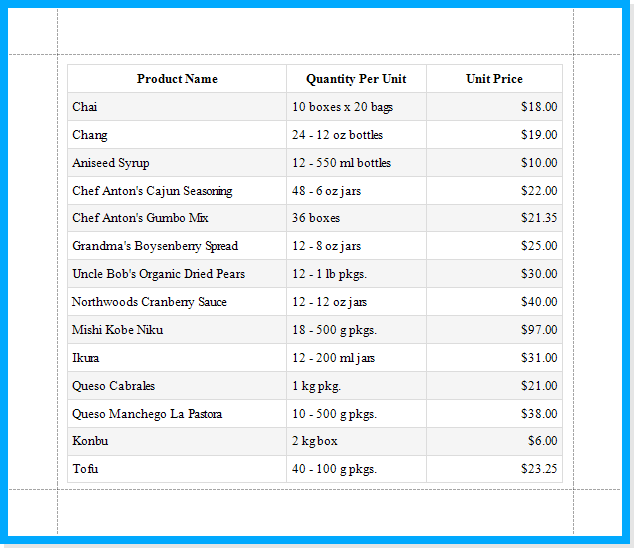
Your report is now ready to be generated. In Visual Studio, you can view the report by switching to the Preview tab.
Create a Table Report at Runtime
Consider the following best practices when creating table reports at runtime:
- Modifying the XRTable.Rows and XRTableRow.Cells collections at runtime should be always performed after calling the XRTable.BeginInit and before calling the XRTable.EndInit methods.
- You are always required to set a correct width to an XRTable object, since adding rows and cells to it at runtime does not change the table size.
- The height of a table should be explicitly specified only if cell content is not expected to stretch the cells (e.g., this may happen when their XRTableCell.CanGrow property is enabled).
- When creating large tables in code, you can increase the report generator performance by setting the XRTableCell.Weight property to 1 for all table cells.
A sample application that demonstrates a table created at runtime is available online at Runtime table creation best practices.