First Look at the Report Designer
- 2 minutes to read
This topic provides an overview of the report editing surface where you can customize your reports at design time within Visual Studio.
Tip
See Adding a Report to Your .NET Application to learn about integrating DevExpress reports into your desktop or web/mobile applications created within Visual Studio.
Whatever application platform you choose, the created reports are platform-agnostic, and you can re-use them in other applications targeting different platforms.
When adding a new report to your application, Visual Studio displays the Report Wizard prompting you to select the type of report you want to create:
-
Creates a new blank report that is not bound to a data source, and finishes the wizard. Choose this option to design your report without using the wizard.
-
Allows you to proceed with the wizard, connect the created report to a data source and configure basic report layout settings (optional).
-
Enables you to create a new report based on available predefined templates.
-
Runs the label wizard enabling you to create labels, badges or price tags by selecting from hundreds of customizable layouts.
Closing the wizard adds a new XtraReport class to your application and opens the created report in the integrated Report Designer:
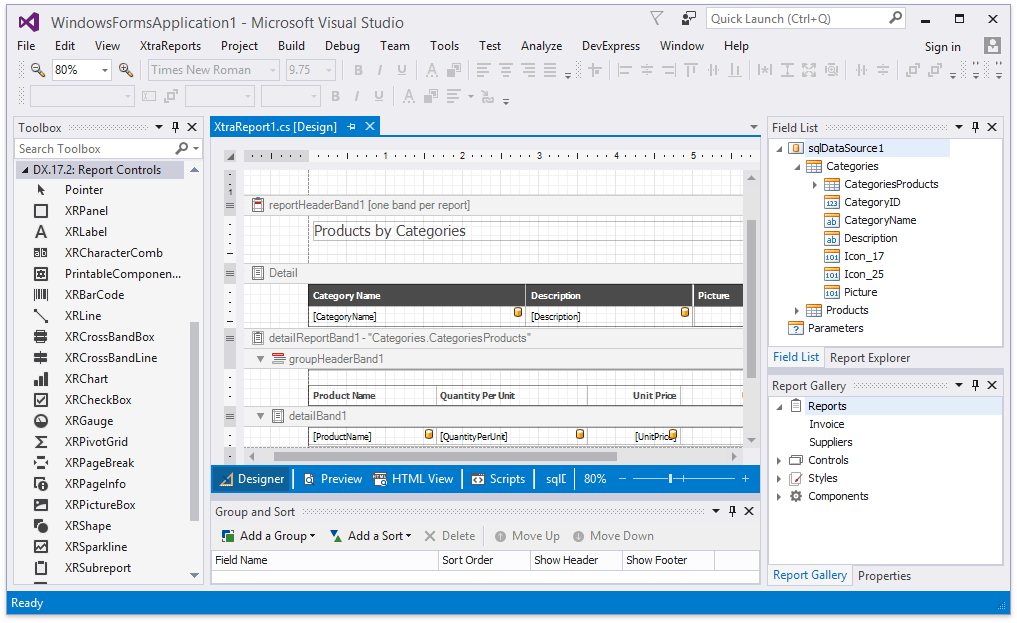
When loading the Report Designer, you can see the report editing surface displaying a report’s structure and contents.
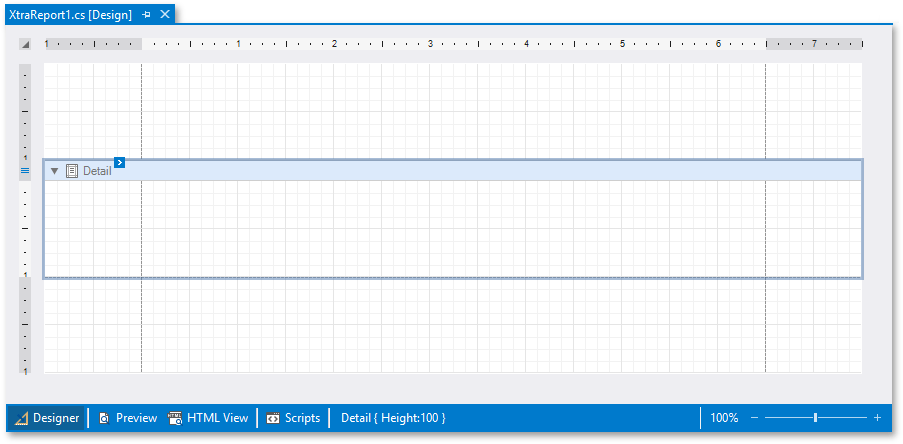
When creating a blank report, this surface displays the top and bottom page margins along with an empty detail band (by default).
Tip
You can make your report display different content by adding other controls to report bands.
See Introduction to Banded Reports for basic information about report bands.
You can change the default zoom factor of the Report Designer using the zoom panel:
While designing a report, you can preview the resulting document by switching to the Preview tab below a report’s design surface:
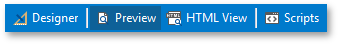
This opens a Print Preview, fills a report’s data source and generates the report document’s pages.
Switching to HTML View displays a published web report document’s HTML layout.
Switching to the Scripts tab enables you to manage and customize report scripts.
Tip
See Detailed Guide to Visual Studio Report Designer to learn more about the Visual Studio Report Designer’s toolbox and dock panels.