Creating a Cross-Tab Report
- 3 minutes to read
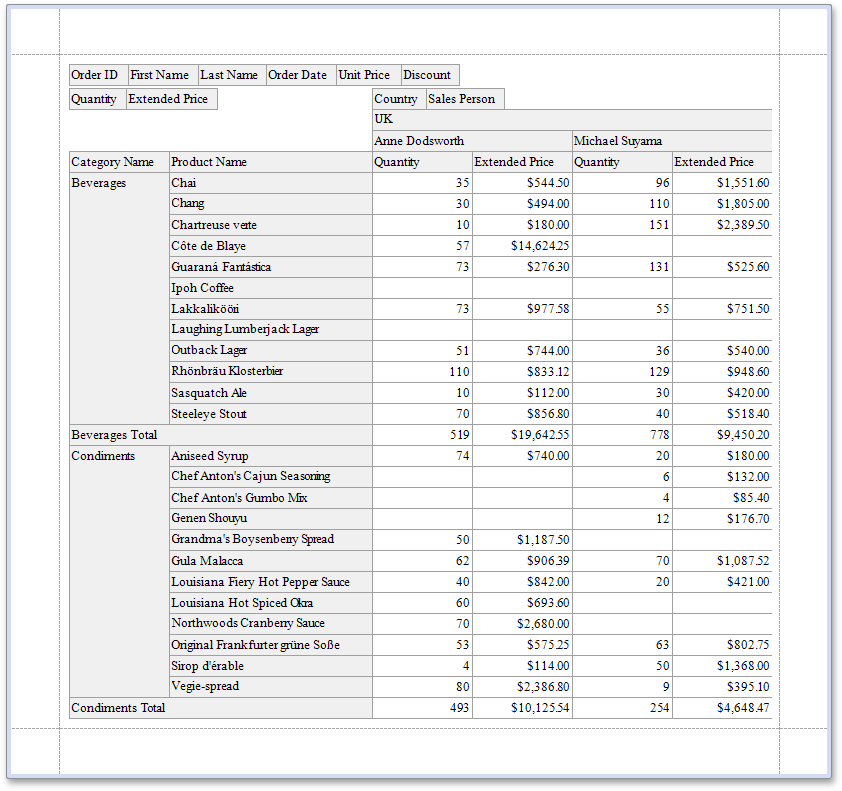
This tutorial describes the steps required to create a cross-tab report by using a Pivot Grid that calculates automatic summaries and grand totals across a large number of grouped rows and columns.
Tip
To get started with this tutorial, open an existing reporting application or create a new one from scratch. To learn how to create a reporting application on the platform of your choice, see Adding a Report to Your .NET Application.
Do the following to create a cross-tab report:
Add a Pivot Grid and Bind It to Data
Open the Report Designer and press CTRL+ALT+X to run the Toolbox. Expand the DX.17.2: Report Controls category and drop the XRPivotGrid control onto the report’s Detail band.
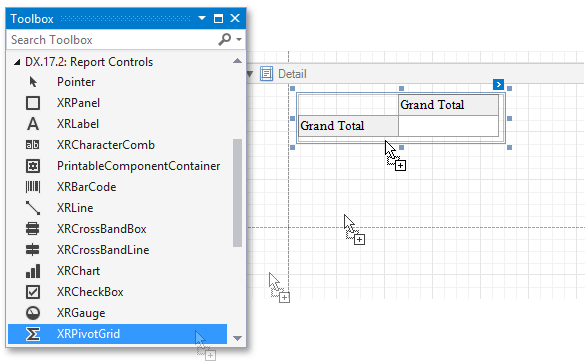
A Pivot Grid cannot be placed within another report control (e.g., XRTableCell or XRPanel), because its width cannot be determined at design time.
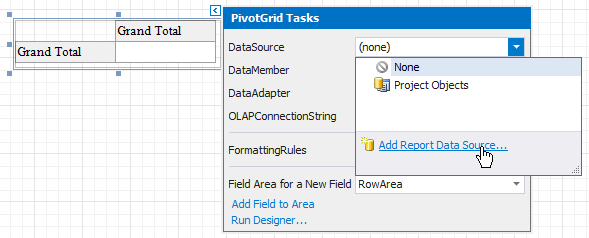
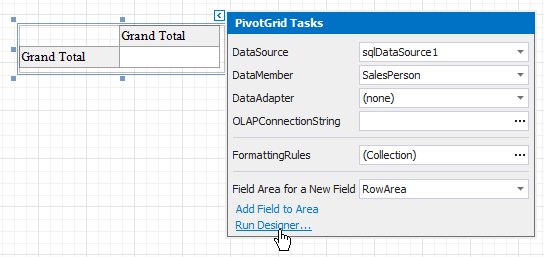
To bind the Pivot Grid to a data source, select the created control and click its smart tag. Expand the drop-down menu for the DataSource property in the actions list that is invoked, and click Add Project Data Source.
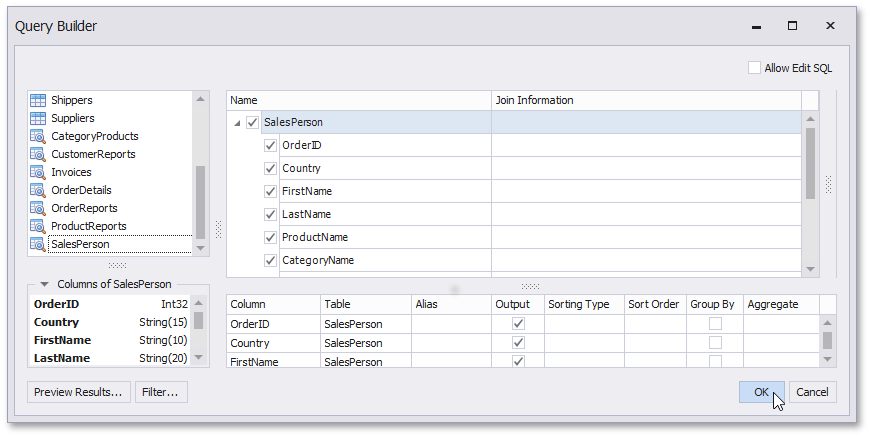
Next, follow the steps in the invoked Data Source Wizard. In this tutorial, the Pivot Grid is bound to the “SalesPerson” view of the sample Northwind database (the nwind.mdb file included in the XtraReports installation).
Note
If the Pivot Grid is placed in the Detail band, ensure that the XtraReportBase.DataSource property of the report is not assigned; otherwise, the Pivot Grid data will be printed as many times as there are rows in the report data source.
Define the Pivot Grid’s Content
To design the Pivot Grid’s layout, click the control’s smart tag and select Run Designer in the actions list that is invoked. This invokes the Property Editor.
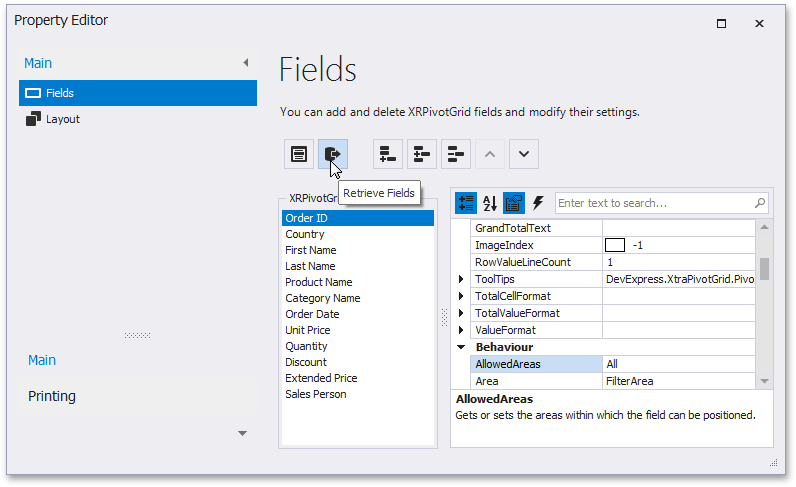
To obtain fields from the Pivot Grid’s data source, click the Retrieve Fields button in the Property Editor.
Switch to the Layout section in the navigation bar on the left and drag-and-drop the required fields onto the appropriate areas to define the Pivot Grid’s layout. For example, you can drag-and-drop the following:
- the CategoryName and ProductName fields to the Row Fields area;
- the Country and SalesPerson fields to the Column Fields area;
- the Quantity and ExtendedPrice fields to the Data Items area.
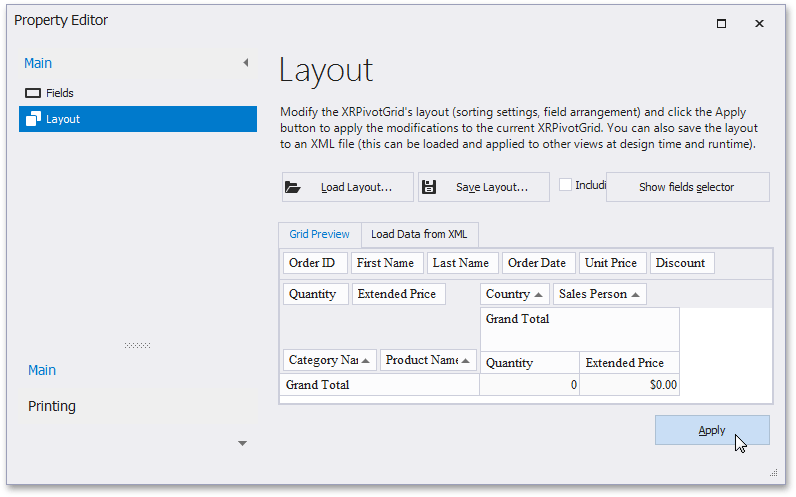
To apply the changes and close the editor, click Apply.
Adjust the Pivot Grid’s Layout
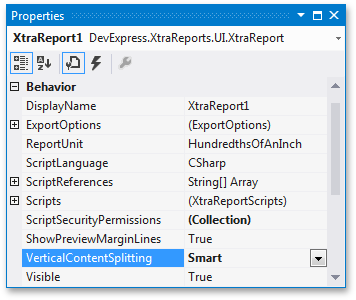
To split the Pivot Grid’s columns precisely by their borders in the Print Preview, set the XtraReport.VerticalContentSplitting property of your report to Smart.
To fit the width of a Pivot Grid’s column to its content, handle the XRControl.BeforePrint event of the XRPivotGrid and call the XRPivotGrid.BestFit method with the PivotGridFieldBase.PrefilterColumnName value passed as a parameter.
Your report is now ready to be generated. In Visual Studio, you can view the report by switching to the Preview tab.
Tip
To learn more about customizing a Pivot Grid, as well as linking it with an XRChart, see Linking a Chart with a Pivot Grid.
Similar to other report controls, XRPivotGrid can only be used within a report.
You can use the following controls to create a Pivot Grid elsewhere in your application:
- WinForms: PivotGridControl
- ASP.NET: ASPxPivotGrid
- WPF: GridControl
To learn more about the core Pivot Grid functionality, see the WinForms Pivot Grid documentation.