Create a Report in JetBrains Rider (CTP)
- 4 minutes to read
This tutorial creates and customizes a DevExpress Report in JetBrains Rider.
Create a New Project
Open JetBrains Rider and click New Solution to create a new project. Specify project settings (WinForms app in this example).

Tip
You can use our Template Kit to start with pre-configured DevExpress Report projects for ASP.NET Core, Blazor, WinForms, and WPF.
Install the DevExpress Report Designer Plugin
In Rider, press
Ctrl+Alt+Sto open the Settings window and then select Plugins.Click the Marketplace tab and type “DevExpress Report Designer” in the search field. Install the plugin.
Restart JetBrains Rider.
Create a New Report
Right-click the project in the Explorer window. Select Add | DevExpress Report from the context menu:

If you work with a .NET project, Rider adds the DevExpress.Reporting.Rider.Design NuGet package automatically when you add or open a report.
Rebuild the solution.
The created report opens automatically and launches the Report Wizard so you can configure the report right away.

To run the wizard again later, click the report’s smart tag and select Design in Report Wizard.
The designer surface is divided into bands that help you build the report flow. A band can appear at the beginning or end of the report, on every printed page, once for each data record, and so on.

You add bands as necessary and drop report controls from the Toolbox onto bands to design the report layout. The following image illustrates a sample report (a table report bound to a JSON data source):

Save a Report
Reports are stored in your project by default (for example, as .cs files using CodeDOM serialization) and are managed like other project files in Rider.
You can also save a report layout to a .repx file. This file stores the report definition in XML format and allows you to persist and reuse layouts outside the current project. Use this approach to distribute report layouts independently of the application, store them externally (for example, in a database or file storage), or load reports dynamically at runtime (such as in web applications).
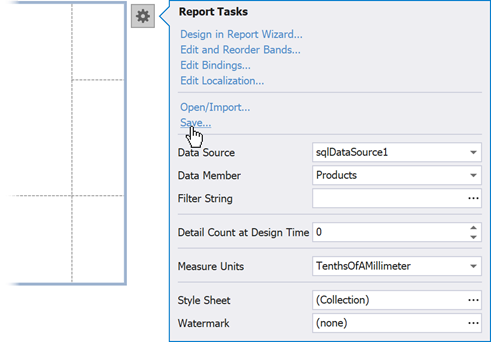
Click the report’s smart tag and select Save to store report definition:
In the Save As dialog, select a folder, type a file name, and click Save:

For more information on storing and reusing report layouts, refer to the following help topics:
Open/Import a Report Layout
Note
Reports created in Report Designers across different IDEs are fully compatible. You can load and edit any report in Visual Studio, Rider, or VS Code.
Click the report’s smart tag and select the Open/Import action.

Select a *.repx file in the invoked Import Report dialog.

What’s Next
Take a moment to familiarize yourself with the tools and features available in your development environment. Start by exploring the Report Designer UI, then proceed to configure your report layout and integrate it into your application.
Explore the Report Designer User Interface
Review the following help topic for more information about UI elements in DevExpress Deport Designer for JetBrains Rider: Report Designer for JetBrains Rider - User Interface.
Note
The following guides use the Visual Studio Report Designer for illustration purposes, but the reporting functionality is consistent across all supported IDEs. You can work with the same reports in Visual Studio, Rider, or VS Code. Minor differences may appear in UI layout or workflow, but the core functionality remains the same.
Configure Reports
- Introduction to Banded Reports
- Describes the basic DevExpress Reports concepts used to build a report layout.
- Create a Report from A to Z
- Contains information on how to configure a basic report using main features of DevExpress Reports.
- Detailed Guide to DevExpress Reporting
- Includes detailed information on how to work with reports: bind to data, use report controls, export documents, and more.
- Create Different Report Types
- Contains tutorials on how to create various report types, such as invoices, master-detail reports, table reports, and others.
Intergate Reports into End-User Application
- Create a Document Viewer and Print Preview Form
- The Document Viewer component displays an interactive document preview and allows end users to print and export reports.
- Create an End-User Report Designer
- The End-User Report Designer is a fully functional reporting tool that allows end users to create, preview, print, export, and save reports.