Reporting Application Diagnostics
- 7 minutes to read
This topic describes how to diagnose problems that may occur in web-based reporting applications.
Client-Side Diagnostics
Use your browser’s developer panel to diagnose application problems on the client side. This topic uses Google Chrome as an example, but you can use similar steps for other browsers.
The flowchart below illustrates the client-side diagnostics process.
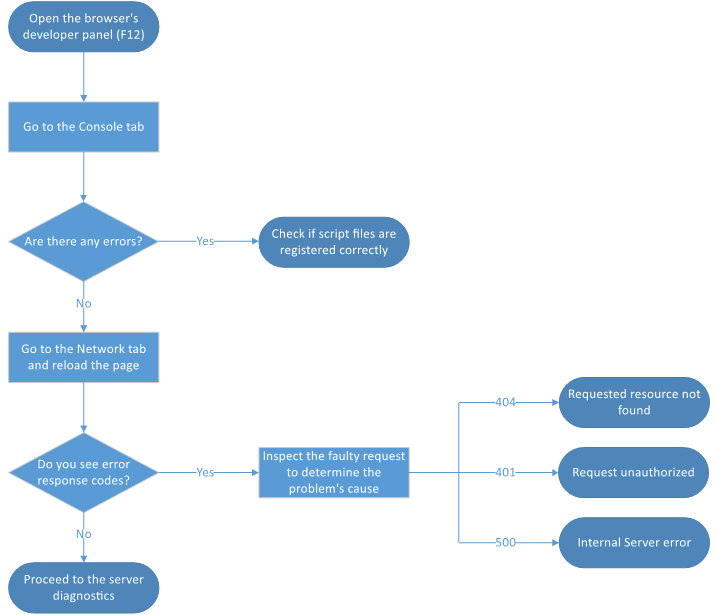
Follow the steps below to diagnose problems with a web reporting application on the client side.
Diagnose JavaScript Errors
Open the browser developer panel (F12). Go to the Console tab and check if the browser console shows any JavaScript errors.
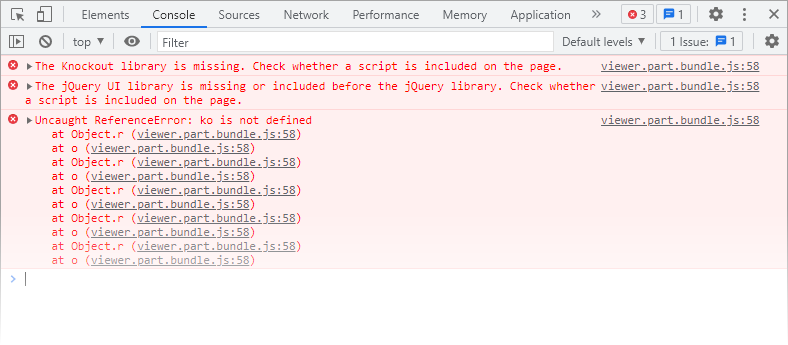
If there are errors, check the following conditions:
Script Registration Order
Automatic registration
ASP.NET Web Forms and ASP.NET MVC projects can register script libraries automatically, if the following keys are specified in the web.config file:
<devExpress>
    <!-- ... -->
    <resources>
        <add type="ThirdParty" />
        <add type="DevExtreme" />
    </resources>
</devExpress>
If the libraries are registered automatically, you should not register them manually to avoid script errors.
Manual Registration
Script libraries must be registered in the following order:
- jQuery.
- Knockout.
- DevExtreme script library
dx.all.js, theme stylesheet:dx.light.cssordx.dark.css.
If an application includes the End-User Report Designer for Web, the following libraries could be included:
- Ace.js editor library to highlight code in the Expression Editor.
- jszip.min.js and dx.richedit.min.js libraries to edit rich text in the XRRichText control at design time.
Subsequently, Reporting for ASP.NET Core projects include the following libraries (ASP.NET Web Forms Reporting and ASP.NET MVC Reporting projects do not need them):
dx-analytics-core.jsdx-webdocumentviewer.jsdx-querybuilder.jsdx-reportdesigner.js
You should register libraries in the order listed above. If you use bundles, make sure the final registration order is the same.
For more information, review the following help topics:
- Client Script Libraries
- ASP.NET Web Forms - External Client Libraries
- ASP.NET MVC - Manual Integration into an Existing Project
Duplicate Registration
Your project may already have links to scripts that our web report components depend on. If you copy the package configuration from our documentation, you may get a mixture of different scripts. To avoid duplicate registration, check each referenced script or bundle.
Script Conflicts
Make sure that there are no conflicts between the scripts. Resolve version conflicts between script dependencies.
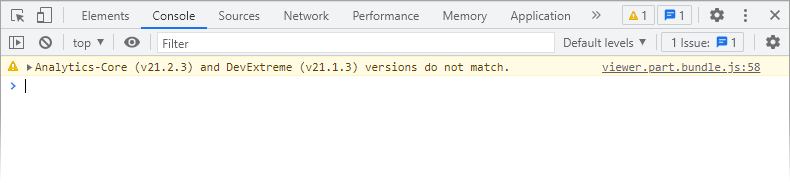
Client Libraries Version
The version of the DevExpress scripts (npm packages) in the ASP.NET Core application should be the same. If versions do not match, the browser console displays a warning:
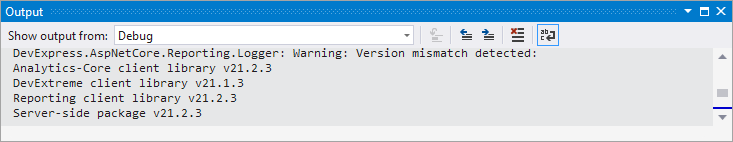
Server-Side Libraries Version
The DevExpress Web Reporting application relies on a server-side application to process reports. The version of the DevExpress scripts (npm packages) should match the version of the server-side libraries (NuGet packages). Do the following:
- In your server-side application, examine the Packages node in the Dependencies section of the Solution Explorer window, or use the Nuget Package Manager to determine the
DevExpress.AspNetCore.Reportingpackage version. - Open the
packages.jsonfile and determine thedevextreme-dist,@devexpress/analytics-core, anddevexpress-reportingversions. - The major and minor versions determined in the steps above should match.
You can enable Development Mode to check for library version mismatch on every request to the server:
var builder = WebApplication.CreateBuilder(args);

builder.Services.ConfigureReportingServices(configurator => {
    configurator.UseDevelopmentMode();
    // You can disable version validation manually:
    // configurator.UseDevelopmentMode(x => x.CheckClientLibraryVersions = false);
    // ...
});

var app = builder.Build();
If versions do not match, the warning is written to the log:
Diagnose Server Response Errors
Open the Network tab, reload the page, and examine the responses from the following server-side handlers:
DXXRDV- Document ViewerDXXRD- Report DesignerDXQB(DXXQBin ASP.NET Core) - Query Builder
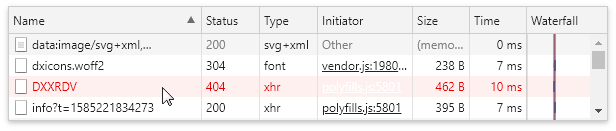
A 4xx or 500 error code means that the web server failed due to an incorrect server configuration. For more information about the error, select the failed request on the Network tab and open its Preview. If the preview does not display any information, make sure that custom exception pages are enabled. The table below lists Microsoft documentation articles that describe how to enable custom exception pages for different platforms:
| Platform | Article |
|---|---|
| ASP.Net Web Forms, ASP.Net MVC |
Displaying a Custom Error Page |
| ASP.Net Core | Developer Exception Page |
The table below lists the most common error response codes:
| Code | Description |
|---|---|
| 400 | The server did not process the request. This may be due to the anti-forgery protection enabled in your application. Review the Prevent Cross-Site Request Forgery part of the ASP.NET Core Reporting - Best Practices code example. |
| 401 | The request was not authorized. The client is not allowed to perform this request. |
| 404 | The server did not find the resource at the specified URL. In a JavaScript reporting application, the server-side application is configured incorrectly, or the host and invokeAction/getDesignerModelAction properties are set incorrectly. |
| 415 | The server refused to accept the request because the message content format is not supported. Make sure that the content types specified on the client and server align. See the following method descriptions for more information: - UseRequestContentType() for ASP.NET Core applications - UseRequestContentType() for ASP.NET MVC and Web Forms applications |
| 500 | The request failed due to an internal server error. |
If you cannot diagnose the problem, contact our Support Center. Save the Network tab’s request information as an HAR file and attach it to your Support Center ticket.
If all requests return 200 (OK) but the problem persists, proceed to the server-side diagnostics section.
Server-Side Diagnostics
The flowchart below illustrates the server-side diagnostics process.
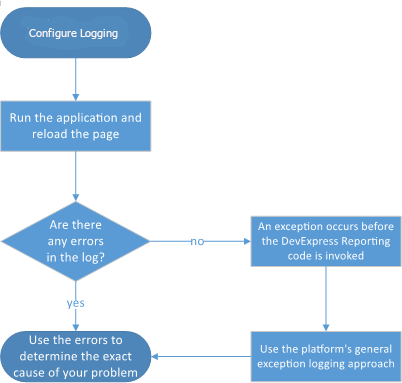
Review the platform-specific sections below to diagnose a web reporting application on the server.
Configure Logging in Blazor (Server and Wasm) Apps with JS-Based Controls
Blazor JS-Based (Server and Wasm) reporting controls use ASP.NET Core backend, so you should use built-in ASP.NET Core Blazor logging. For more information, review the following help topic: ASP.NET Core Blazor logging.
Configure Logging in ASP.NET Core
ASP.NET Core apps use built-in logging. You can configure logging for the DevExpress category as described in the Configure logging section of the following article: Logging in .NET Core and ASP.NET Core.
Configure logging in the appsettings.json file:
  "Logging": {
    "LogLevel": {
      "Default": "Information",
      "Microsoft": "None",
      "Microsoft.Hosting.Lifetime": "None",
      "DevExpress": "Debug"
    }
  }
You can also specify logger options at application startup:
using Microsoft.Extensions.DependencyInjection;
using DevExpress.AspNetCore.Reporting.Logging;

var builder = WebApplication.CreateBuilder(args);

builder.Services.Configure<LoggerOptions>(logOptions => {
    logOptions.LogMachineName = true;
    logOptions.Prefix = "START: ";
    logOptions.LogTimeStamp = true;
    logOptions.Suffix = " :END";
});

var app = builder.Build();
With the specified settings, the log appears as follows:
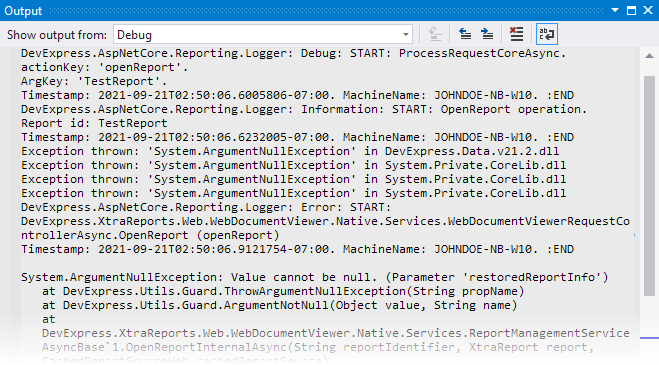
The sample log in the above image contains information about an error that occurs when the Document Viewer cannot find a report specified by name.
Tip
When you contact our Support Center, attach the log file, as it can help diagnose the problem.
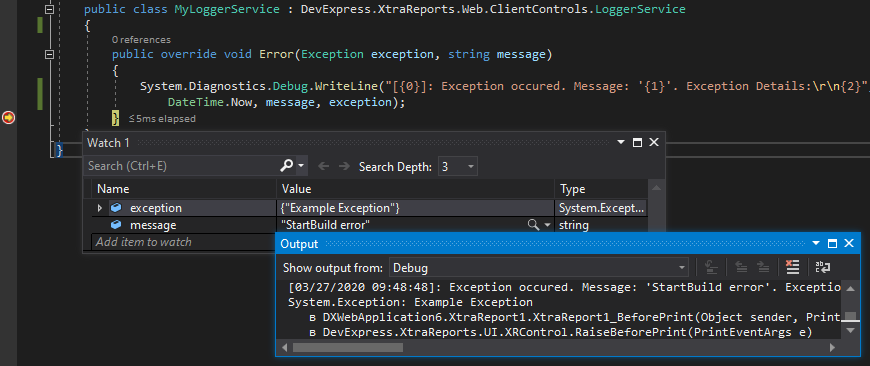
Configure Logging in ASP.NET Web Forms & MVC
Create and register a custom LoggerService with the Error method, which saves errors to a log file or database. If a debugger is attached, you can set a breakpoint and view errors in the Watch window. Examine these errors to find the cause of the problem.
If you cannot determine the exact cause of the error, send the error message, the call stack, and information about internal exceptions to the Support Center.
If the LoggerService’s Error method is never called and the log contains no errors, make sure that the service is registered correctly. If the service registration is done correctly, the exception occurs in your application code before the application calls DevExpress Reporting components. Apply a general technique to register exceptions in this case. For more information, review the following article: Adding Error Logging Support.