Visual Studio Report Designer at a Glance
- 3 minutes to read
Design a Report Layout
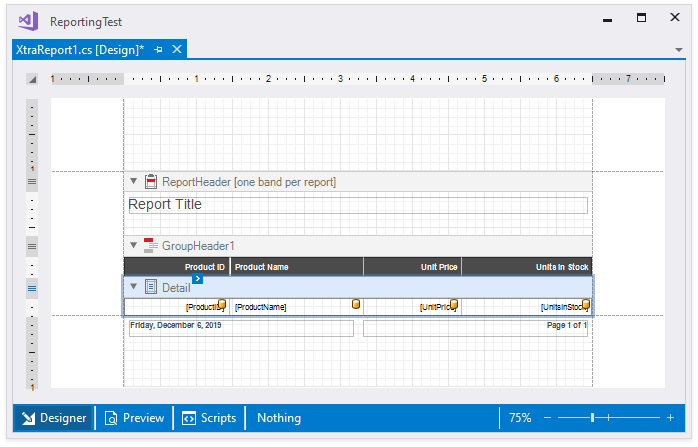
A report consists of the report controls arranged in report bands on the design surface.
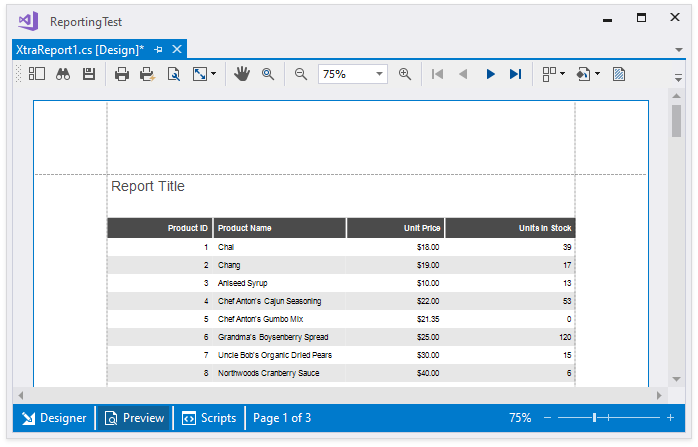
The picture below illustrates report controls and bands that form a Table Report
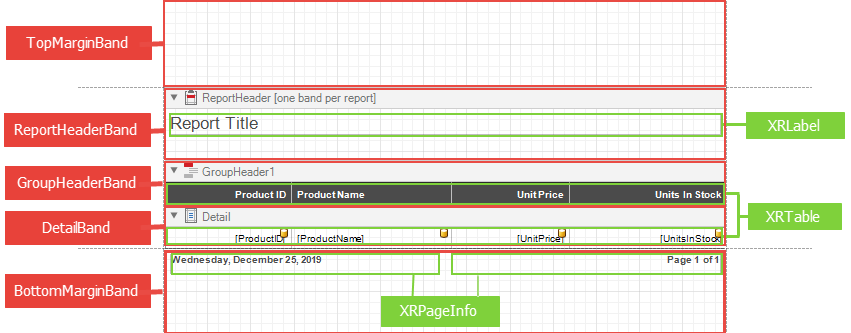
ReportHeaderBand - an optional band that contains the report’s title. It is displayed on the first report page. You can also add the ReportFooterBand to the last report page.
The GroupHeaderBand and GroupFooterBand enclose report groups. They allow you to group and sort data.
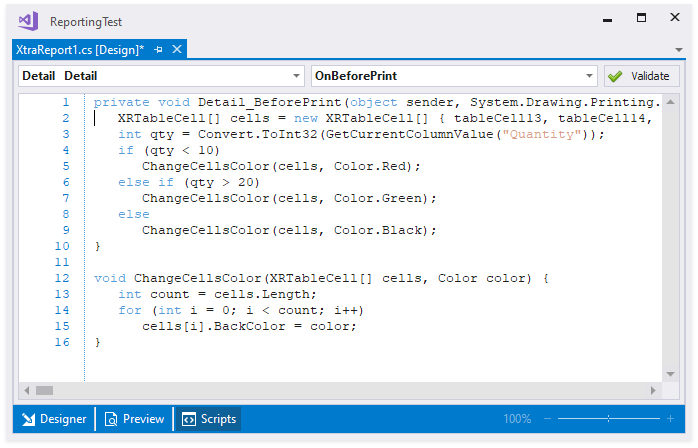
DetailBand is an integral part of the report. Any report contains it, and this band cannot be deleted. It repeats for every data record displayed in the report.
The XRLabel control displays text.
XRTableCell, XRTableRow, XRTable controls are elements of a table.
The XRPageInfo control displays the auxiliary information: page number, creation date and so on.
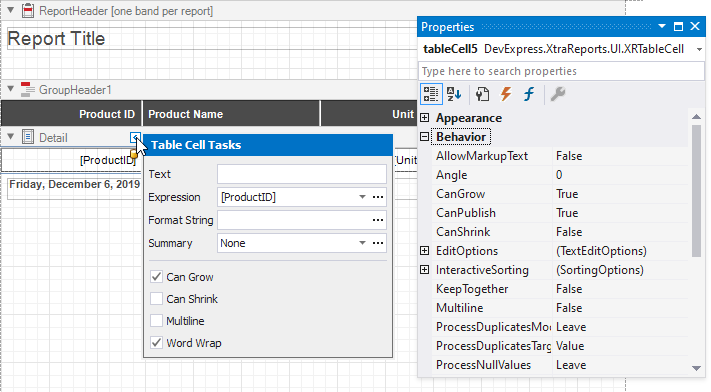
You can select any report control and use the Property grid to change its settings. A control displays a smart tag with most frequently used control settings and tasks.
To add a new report control, drag and drop it from the Visual Studio Toolbox. To create a control bound to a data source field, drag-and-drop this field from the Field List panel.
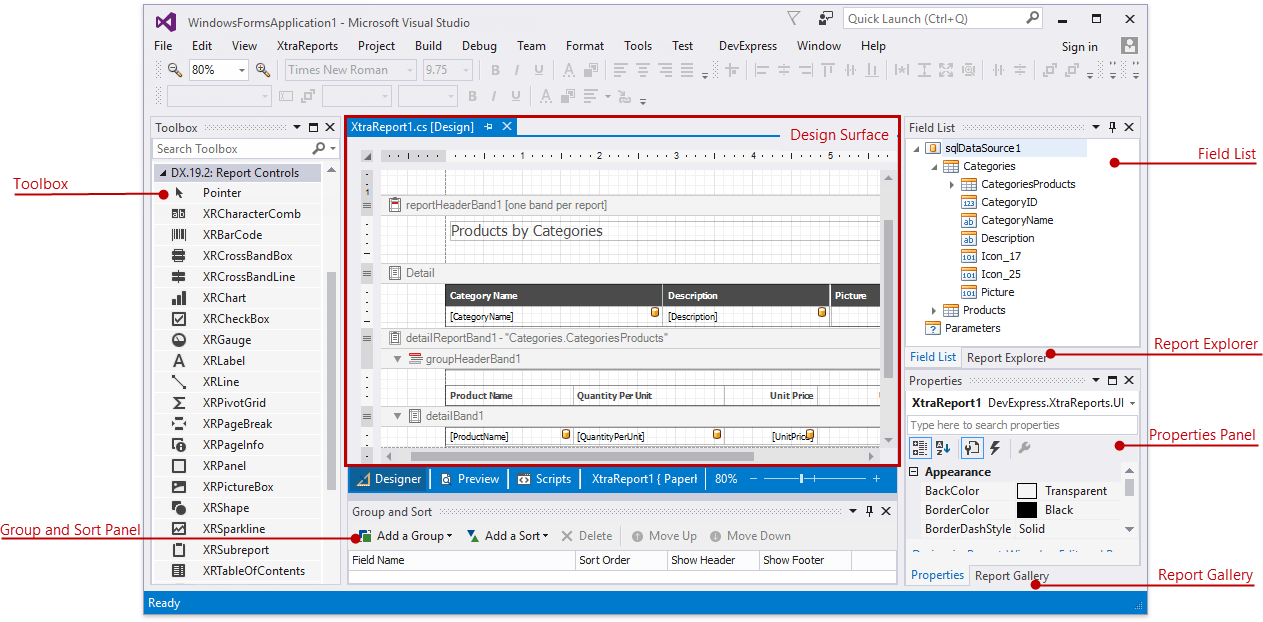
Report Panels for Visual Studio
When you create a DevExpress Report, all report panels are shown. You can dock these panels in Visual Studio, or close those you do not need. You can access closed report panels from the “XtraReports” main menu item in Visual Studio.
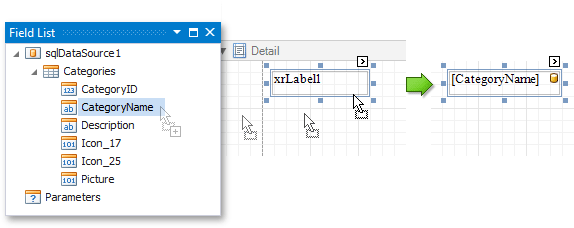
Field List. Displays the report data fields. You can drag the fields on a report surface to create a report control. The control type is determined automatically, however, you can select a control to display the field contents. In the picture below a string field creates a new XRLabel control.
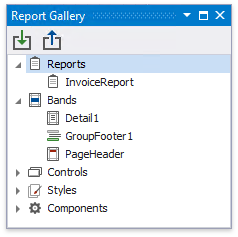
Report Gallery. Displays reports and elements that you can reuse in other reports. To add elements to the gallery, right-click layout elements and select “Add To Gallery”.
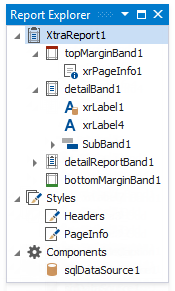
Report Explorer. Displays the report structure in a hierarchical tree-like format. Allows you to re-arrange report elements, change their settings, and add them to the Report Gallery as templates.
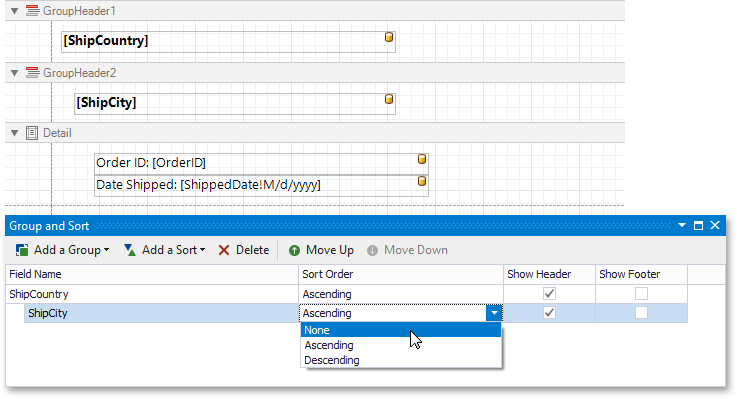
Group and Sort. Allows you to group and sort report data. This panel is active only when a report is bound to a data source.
Zoom factor
Use the zoom panel to change the Report Designer’s zoom factor:
Preview Tab
Switch to the Preview tab to preview the resulting document.
This action populates a data source, generates the report document and displays it in a Preview Window.
Designer
Preview
Script Tab
The Scripts tab enables you to create and edit report scripts.