Introduction to Banded Reports
- 6 minutes to read
A report layout consists of bands that contain report controls and define their location on document pages.
Bands are printed from top to bottom on a page when a report document is generated. The BeforePrint event occurs before band content is displayed on the report page. You can handle the BeforePrint event and make final adjustments to the controls that will be printed on the page. Since the report has already printed band content, any modifications you make to the controls in that band will not be in effect.
Report Bands
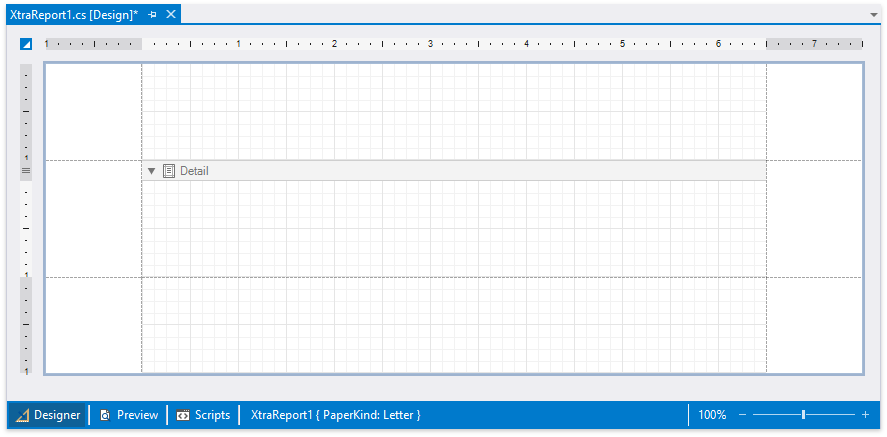
A blank report contains the following bands:
The Detail band is printed for every record in a data source unless you filter data.
Every report should have the Detail band and you should not be able to delete it.
The Top Margin and Bottom Margin bands. These bands are repeated once on every document page.
You can also add the following bands:
Report Header and Report Footer
The Report Header is the report’s first band (margins are “out-of-page” zones). Use this band to display the report’s name, company logo, date of creation, username, etc.
The Report Footer is placed before the Page Footer and Bottom Margin on the report’s last page. You can use the Report Footer band for report summaries or conclusions.
Page Header and Page Footer
These bands are at the top and bottom of every page in a report. They display information that should be printed on every page.
Group Header and Group Footer
These bands are above and below each group. The Group and Sort Panel create these bands automatically.
Tip
Only detail and group bands can be used to display dynamic data source contents. Other bands display titles, summaries, and extra information.
The following image illustrates a sample report layout and the Report Explorer that reflects report structure:

Add a Detail Band to a Master-Detail Report
Use the Detail Report band to create hierarchical master-detail reports. Detail report bands provide detailed information about each record in the master report’s Detail band (for example, orders shipped to each customer). You can create such reports when master-detail relationships are defined between data source tables:

The Detail Report band is a separate report (subreport) with its own data source and different bands. A report can have any number of detail reports that can also be nested.
The following image illustrates a master-detail report and the Report Explorer that reflects report structure:

Vertical Bands
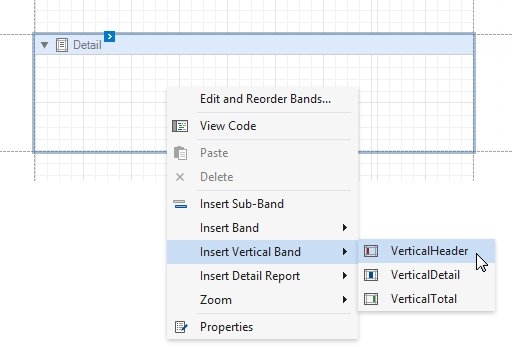
You can replace the Detail band with the Vertical Header, Vertical Detail and Vertical Total bands to display record fields vertically and print data records horizontally - from left to right (and vise versa if the report’s RTL mode is enabled).
To add vertical bands to your report, right-click the report in the Report Designer and choose Insert Vertical Band in the invoked context menu.
Note
If your report’s Detail band contains report controls, this band and all these controls are lost when you add a vertical band (the same behavior takes place in the opposite situation).
The following vertical bands are available:
- Vertical Header
Contains report data field headers. These headers are arranged vertically. - Vertical Details
This band is printed for every record in a data source unless you filtered data. The records are displayed one after another in a horizontal direction. - Vertical Total
This band is placed at the rightmost position (leftmost when RTL is enabled). You can use the Vertical Total band for report summaries or conclusions.
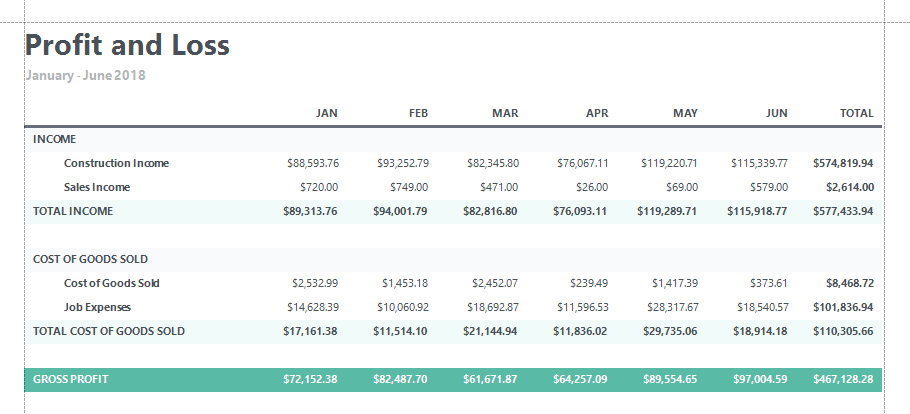
You can use the Report Wizard to create a report with vertical bands. Refer to the Create a Vertical Report in the Visual Studio Report Designer topic for instructions on how to create a report based on the Profit and Loss product demo.
Cross-Band Content
You can place the data panel on a separate band that is printed in the background of other bands. For an example, refer to the following help topic: Create a Report with Cross-Band Content and Populated Empty Space in the VS Report Designer.
Create Band Copies
Band copies can be created, for example, to display different contents based on a specific condition. To do this, add sub-bands to bands.

Tip
See Lay out Dynamic Report Contents for details on how to specify band content location on document pages.
Manage Report Bands
Expand or Collapse Bands in the Report Designer
Click the arrow button on a band’s title to collapse or expand that band.

Right-click the report and select Collapse All Bands from the context menu to collapse all bands in a report. Select Expand All Bands to expand all report bands.

Right-click a band and select Collapse Other Bands from the context menu to collapse all bands except the clicked band.

Hide Bands in the Report Document
You can avoid printing band content in a document. To do this, set the band’s Height property to zero or its Visible property to false. After, select the band and set these properties in the Properties window.

Note
The BeforePrint event does not fire for bands whose Visible property is set to false.
Remove Bands
Select a band on the report design surface and press DELETE. This removes the band and all its content.
Add Bands
To add a band, right-click the report design surface and choose Insert Band in the invoked context menu.

You can insert the Detail Report band into a report if the report’s data source has master-detail relations.

Access the Bands Collection
You can access the band collection in one of the following ways:
Click the Edit and Reorder Bands context link in the report smart tag to access the report’s bands collection.

This command is also available in band context and smart tag menus.

The invoked editor allows you to reorder bands and change their properties.

When you add a
GroupHeaderBandorGroupFooterBandat design time or in code, the designer also displays its counterpart for that level in the editor. This counterpart is not an actual band - it is a placeholder that indicates a matching band can be added. To use it, you must explicitly add the corresponding band first.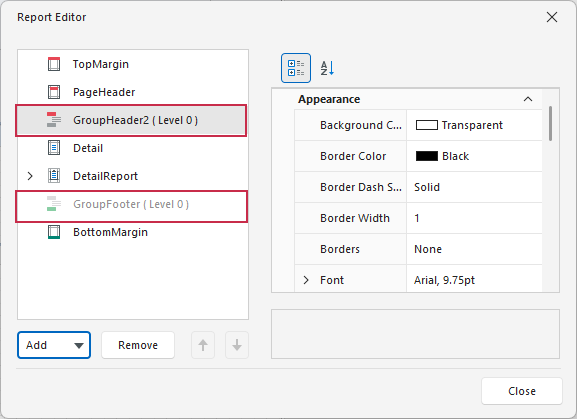
Use the Report Explorer to edit and reorder bands. Select a band and edit its properties in the Properties grid.
Drag a band to change its order or move inside/outside of another band. The drop targets are highlighted when you drag a band over them.
You can drag bands to the following targets:
Dragged Band
Drop Targets
All bands except TopMarginBand and BottomMarginBand
XtraReport (root node), DetailReportBand
XtraReport (root node), DetailReportBand
Apply Styles to Bands
Select a band and switch to the Properties window. Expand the Styles group and set the Style property to the style name.

As an alternative, you can drag a style from the Report Explorer onto a band. This is applicable to all bands except DetailReportBand.

Introduction to Banded Reports in the End-User Report Designer
Tutorials that explain how to use this functionality in EUD Report Designers for WinForms and Web are included in the End-User Documentation online help section: