Create a Report from A to Z
- 2 minutes to read
This section contains step-by-step tutorials that demonstrate how to create a simple table report that covers basic features of DevExpress Reports.
Tip
DevExpress Reports offer the following AI-coding assistant extensions to help you create reports in Visual Studio and JetBrains Rider Report Designer more efficiently:
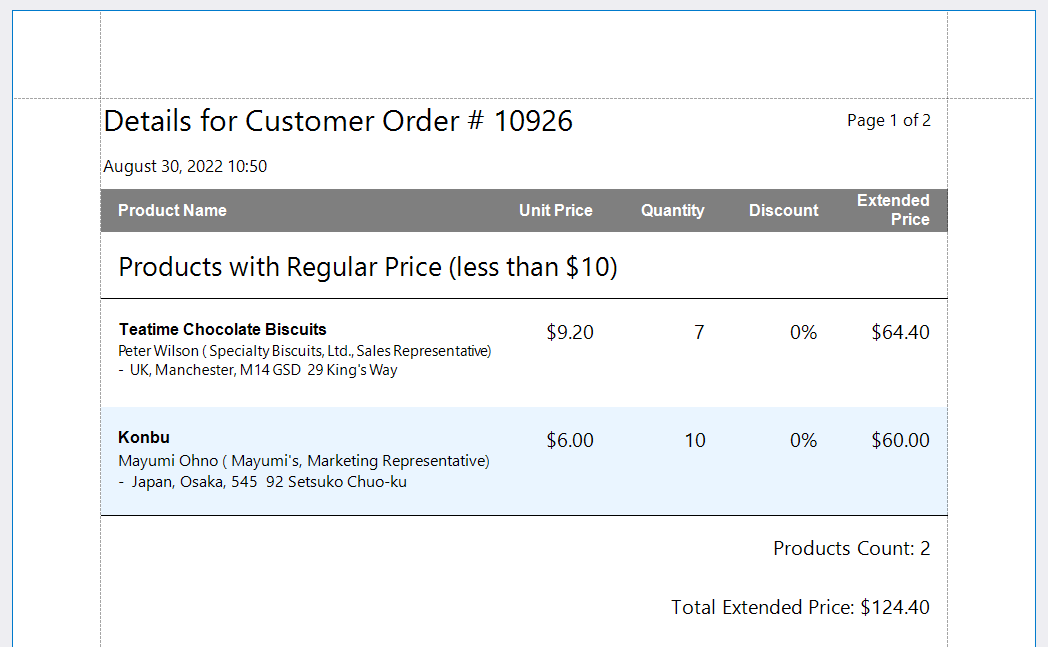
- Tutorial 1 - Bind a Report to Data
- Explains how to bind a report to an SQLite database.
- Tutorial 2 - Design the Report Layout
- Describes how to display data from the database in a table and format the content of the table cells.
- Tutorial 3 - Use Parameters to Filter Report Data Dynamically
- This article describes how to filter table records dynamically using report parameters.
- Tutorial 4 - Customize Report Appearance
- Shows how to use report styles to customize the table appearance and get a nice-looking report document.
- Tutorial 5 - Group Report Data and Calculate Summaries
- Explains how to group table records by prices and calculate group summaries.
- Tutorial 6 - Add Navigation to a Report
- Describes how to add page numbers, a document map, and a table of contents to the report.
- Tutorial 7 - Add Interactivity to a Report
- Demonstrates how to enable content editing and sorting in Preview.
You can also review the following example that illustrates reporting features such as bands and controls, calculated fields, appearance, formatting rules, parameters, summaries, a summary chart, a table of contents, and more.
See Also