Tutorial 5 - Group Report Data and Calculate Summaries
- 5 minutes to read
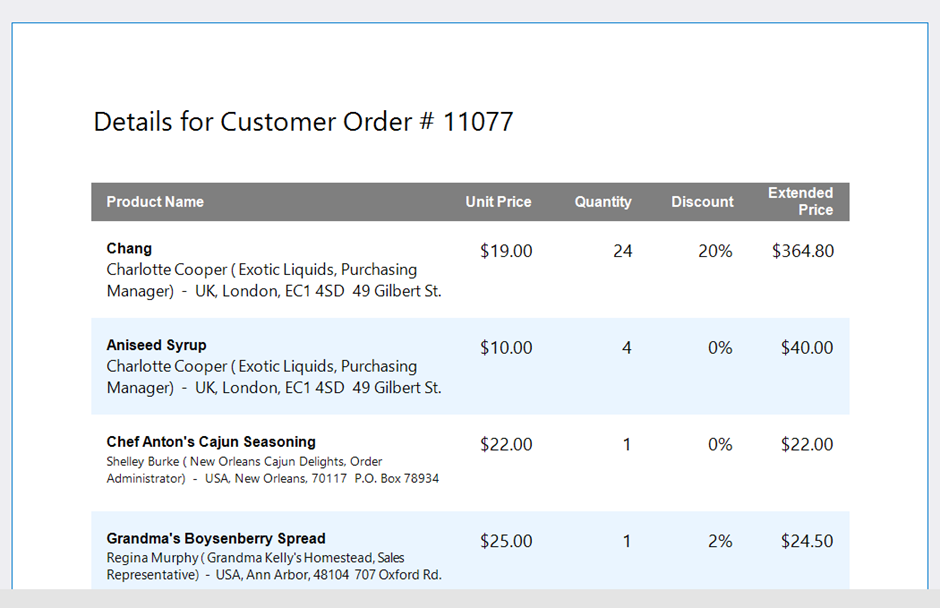
In the previous tutorial, we customized the report appearance to get a nice-looking report document with alternating record colors and formatted table values:
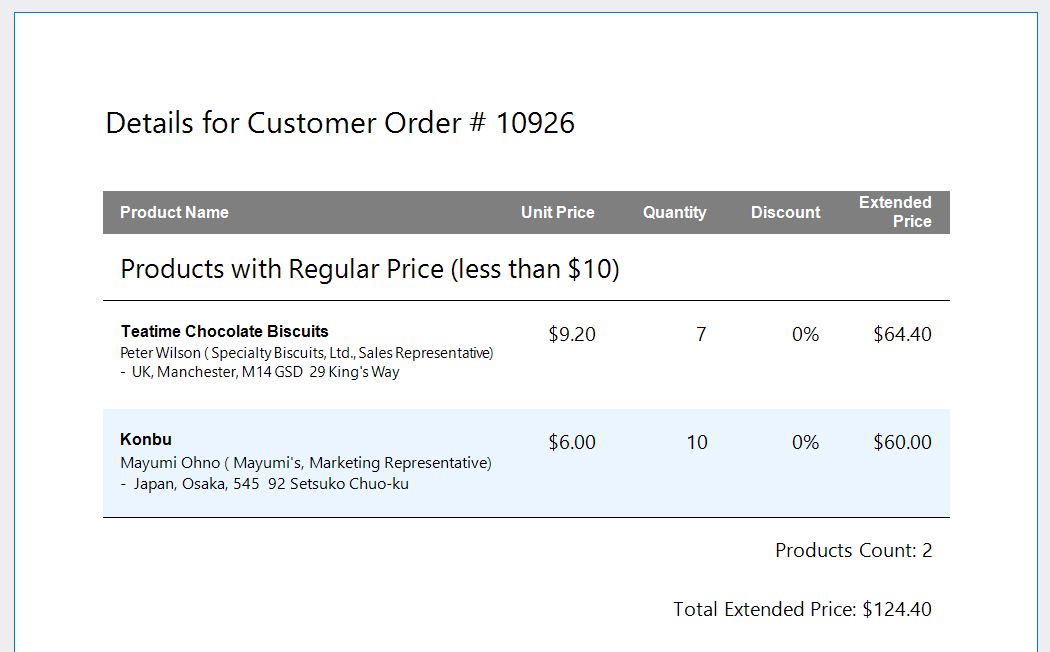
In this tutorial, we will explain how to group report data and calculate group summaries:
- Create a new data source field (a so-called calculated field) that will allow us to divide table records into two groups based on product price. The first group will include products whose price is less than $10 (we will refer to such products as “products with regular price”), and the second group will contain the remaining products (we will refer to such products as “expensive products”).
- For each of these groups, we will display the number of records and the total extended price.
Create a Calculated Field
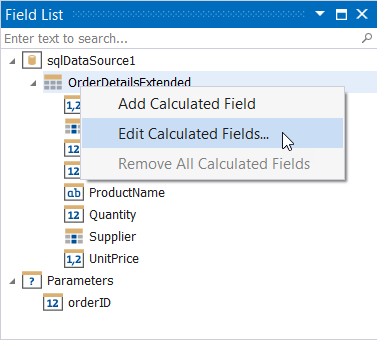
Switch to the Field List, right-click the OrderDetailsExtended view, and select Edit Calculated Field in the invoked context menu.
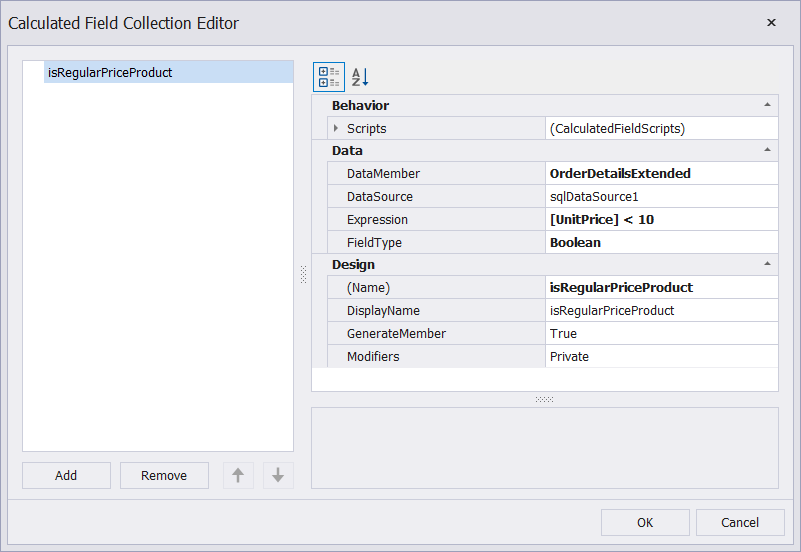
Create a new calculated field in the invoked Calculated Fields Collection Editor. Specify the field’s properties as follows:
Property | Value |
|---|---|
| OrderDetailsExtended |
| sqlDataSource1 |
| [UnitPrice] < 10 |
| Boolean |
| isRegularPriceProduct |
Group Table Records By Price
Create a Group
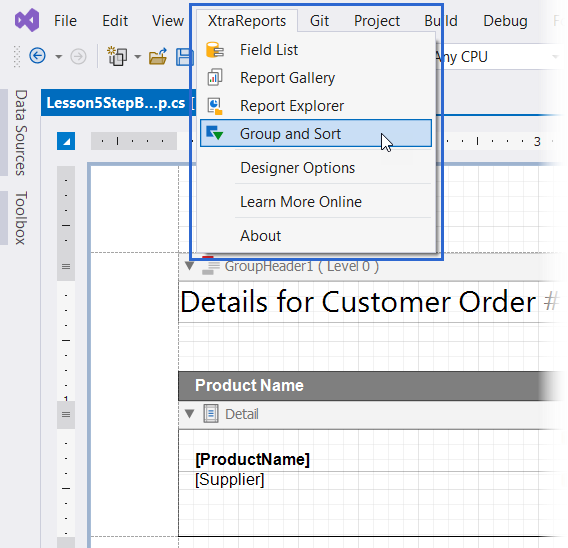
Navigate to the Group and Sort panel.
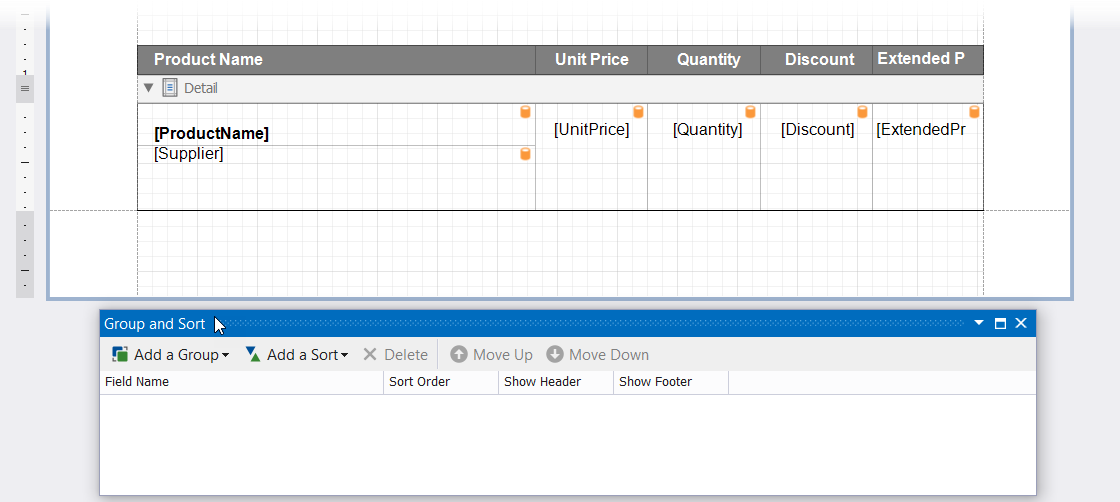
Note that this panel can be disabled in your project. To enable the panel, click the XtraReport menu and select Group and Sort item.
Expand the Add a Group drop-down list and select the isRegularPriceProduct calculated field.
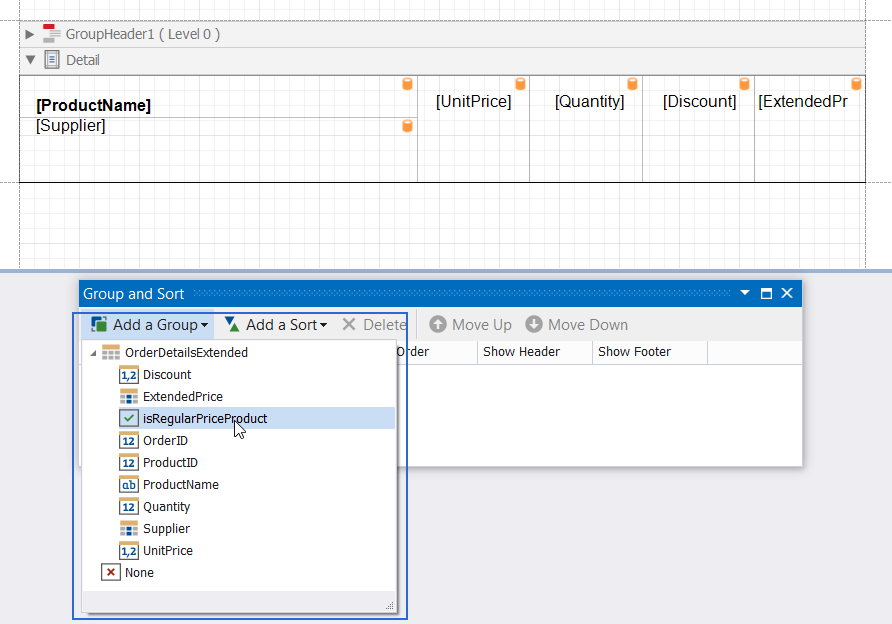
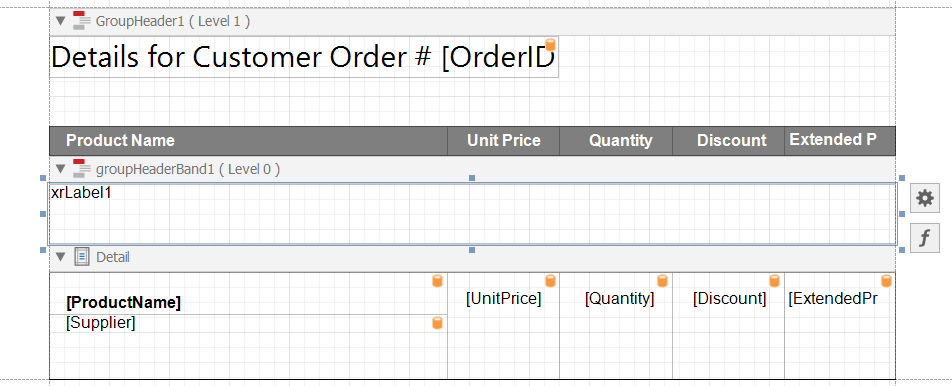
This action creates a new report group and adds a new GroupHeader band to the report.
Configure Group Settings and Appearance
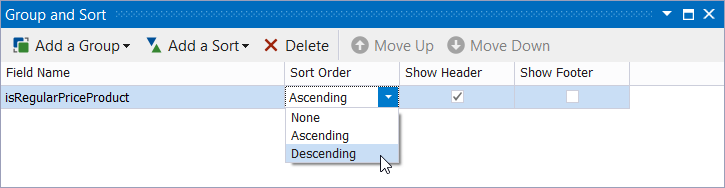
Set the group’s Sort Order property to Descending to show a list of products with regular prices first (isRegularPriceProduct = 1) and then the list of expensive products (isRegularPriceProduct = 0).
Set the height of the new GroupHeader band to 50. Drop a label from the Toolbox onto this band. Change the label size to make this label occupy the entire band.
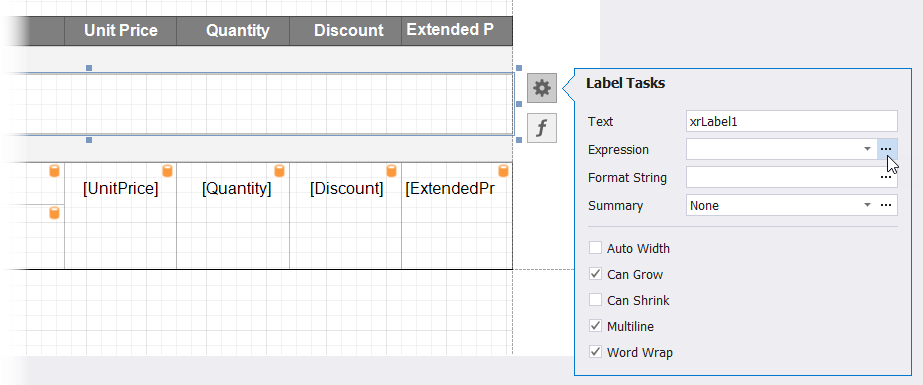
Configure the label so that it displays information about the current group. Click the label’s smart tag and select the Expression property’s ellipsis button.
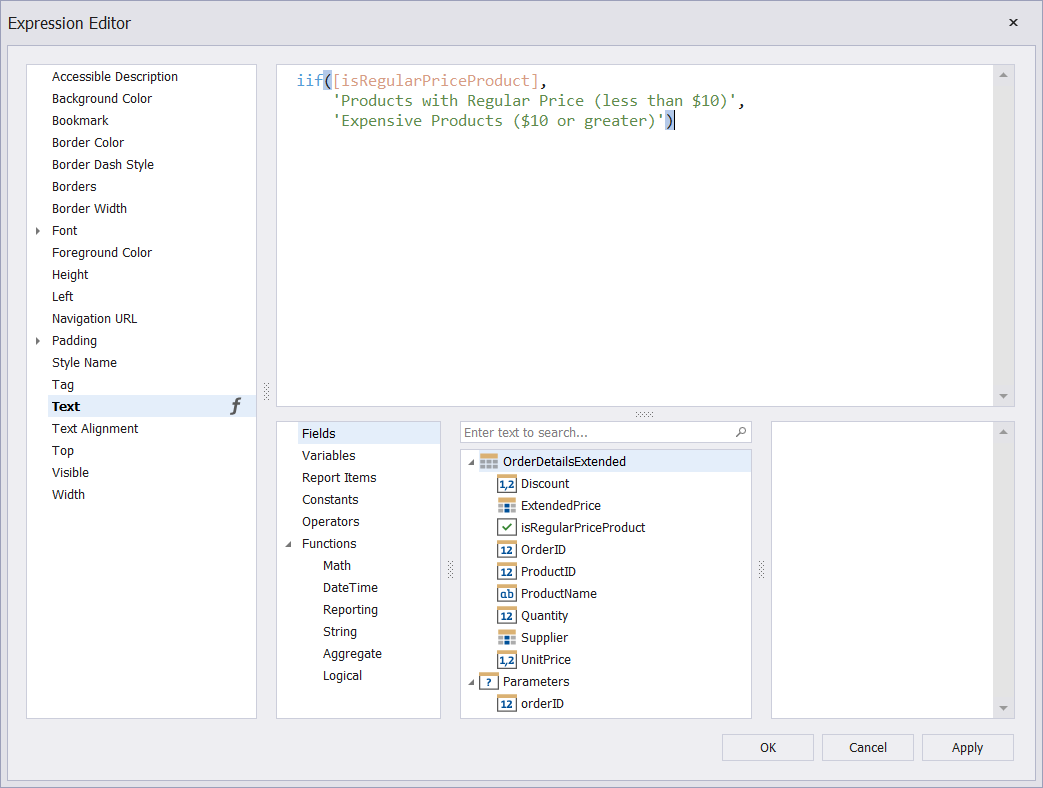
In the invoked Expression Editor, assign the following expression to the label’s Text property:
iif([isRegularPriceProduct],
    'Products with Regular Price (less than $10)',
    'Expensive Products ($10 or greater)')
Click Apply, then OK.
Configure the label appearance. To make information about the current group more readable, set the label’s font size to 16pt. You can also change the label’s font as required (we use "Segoe UI" in this tutorial).
To align label content with the content of the first table cell, set the label’s TextAlignment and Padding properties to MiddleLeft and (15, 2, 0, 0) respectively.
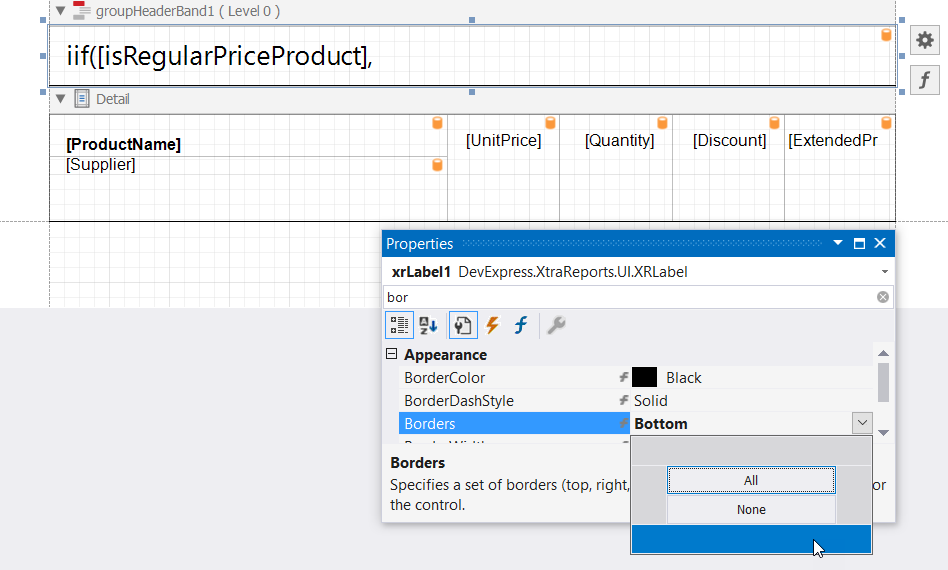
Enable the label’s bottom border to visually separate information about the current group and group records.
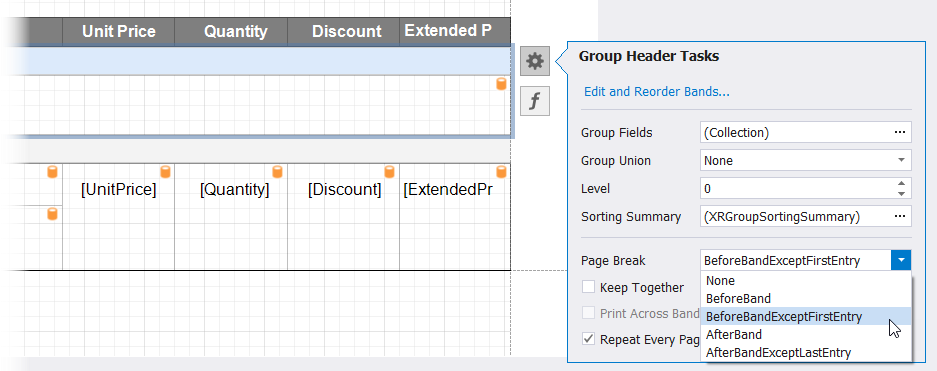
Configure the new GroupHeader band so that it repeats information about the current group on every page and displays the group with expensive products on a new page.
Select the band and click its smart tag. Enable the band’s Repeat Every Page property and set the Page Break property to BeforeBandExceptFirstEntry.
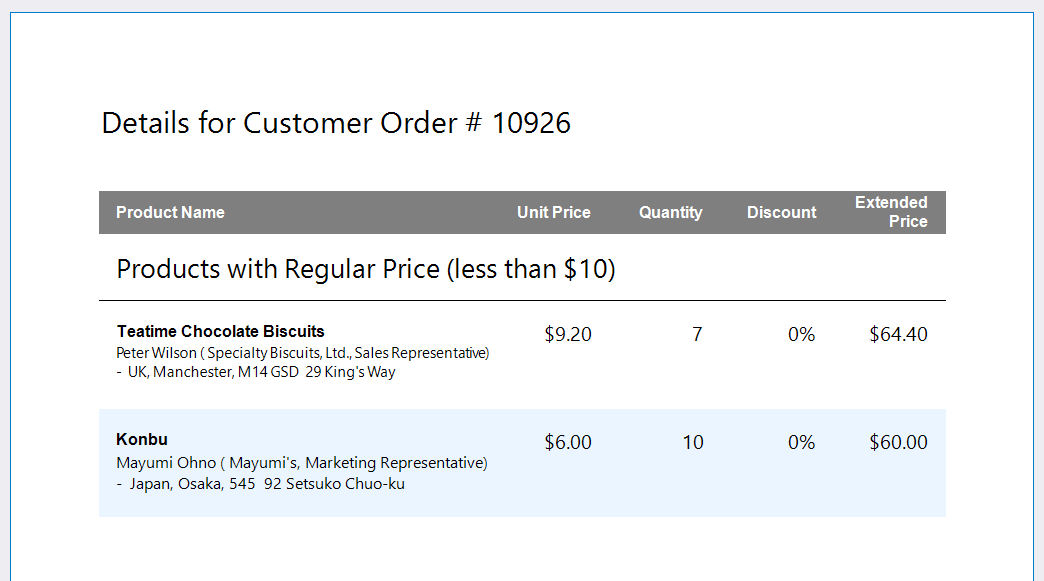
Switch to the Preview tab and set the Order ID parameter value to 10926. The generated report document contains two pages. The first page displays products with regular prices.
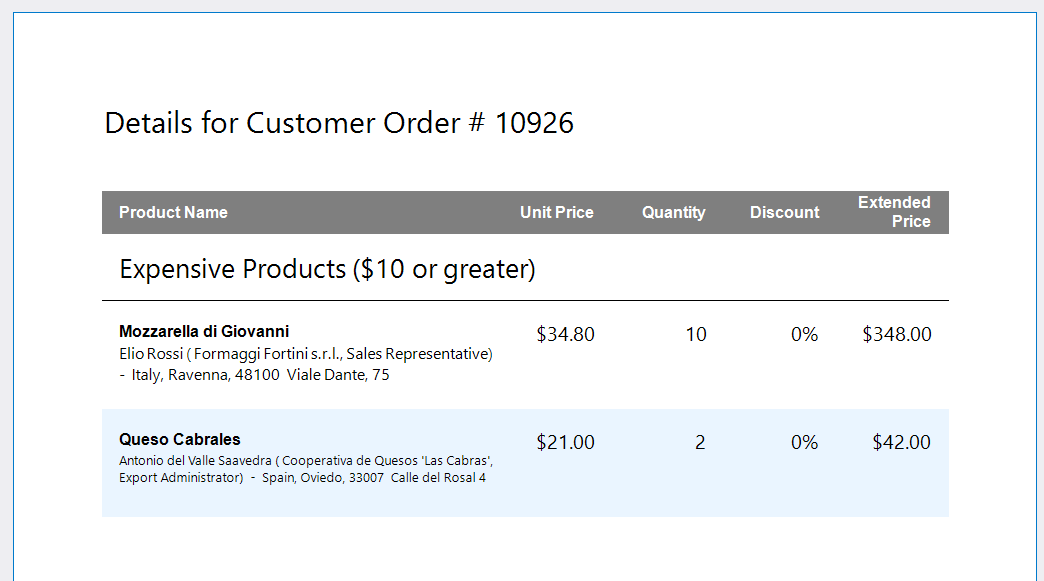
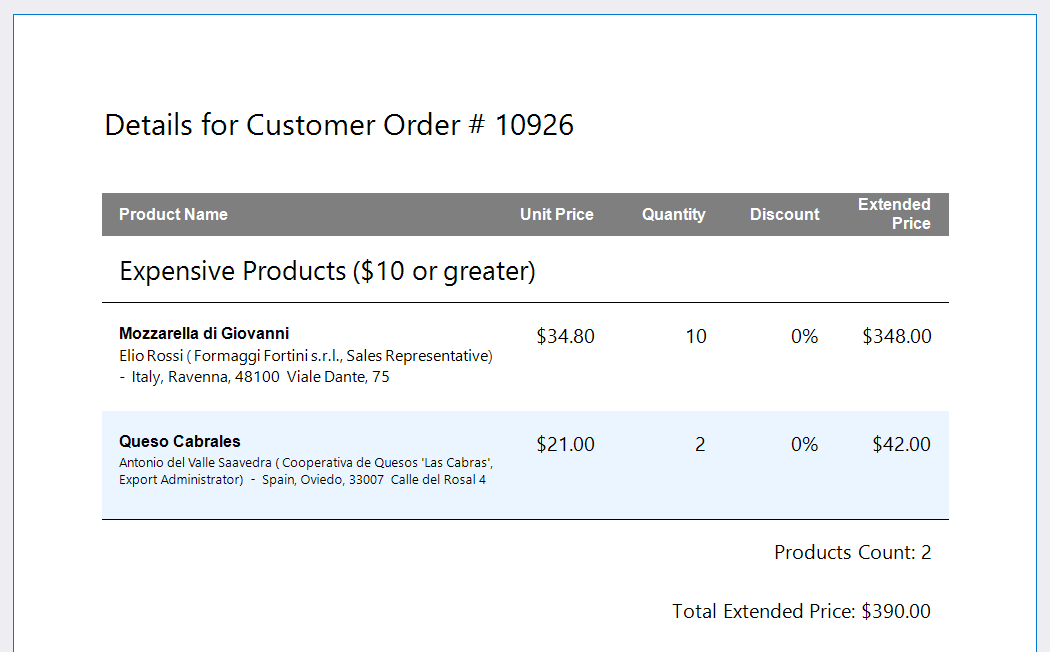
The second page displays expensive products from the same order.
Calculate Summaries within the Group
Navigate to the Group and Sort panel and enable the Show Footer property.
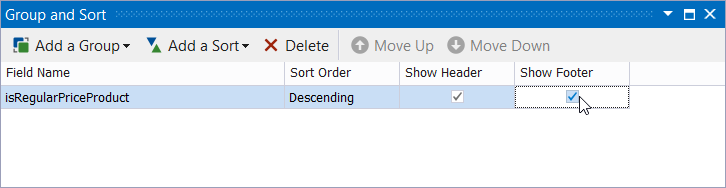
This action creates the Group Footer band that we will use to display group summaries.
Drop two labels onto the Group Footer band. Place the labels under each other and make them occupy the entire band as shown in the following image:
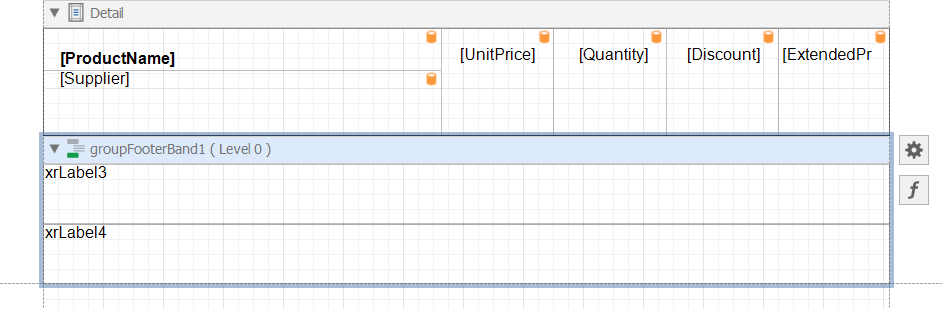
Configure the labels so that the upper label displays the total number of products in the group, and the bottom label displays the total extended price of the group.
Select the upper label, invoke its smart tag, and set the label’s Summary, Expression, and Format String properties to Group, sumCount([ProductID]), and Products Count: {0} respectively.
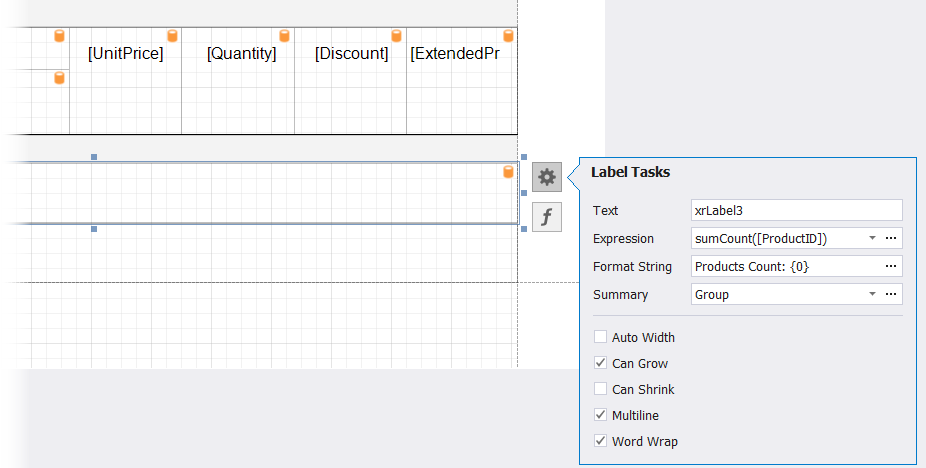
Enable the label’s upper border to visually separate summaries and group records.
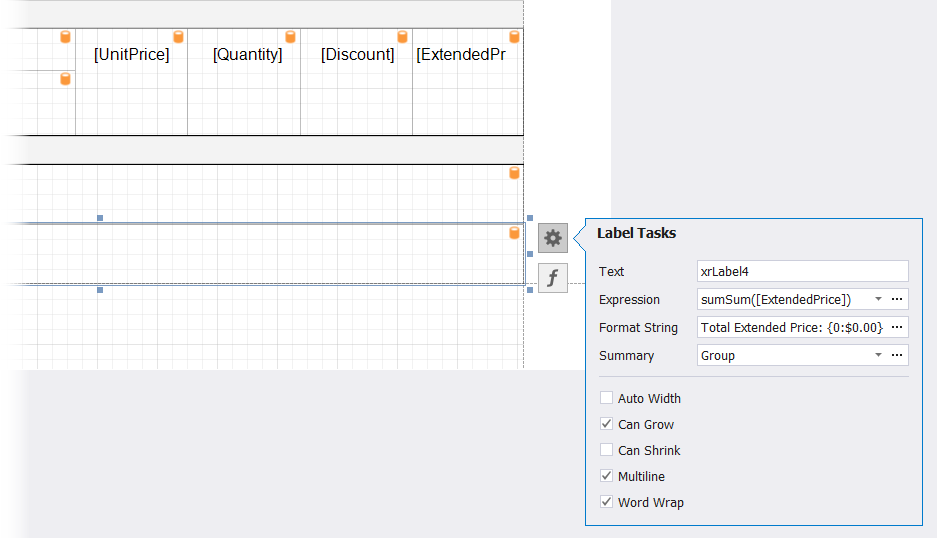
Similarly, set the Summary, Expression, and Format String properties for the label at the bottom to Group, sumSum([ExtendedPrice]), and Total Extended Price: {0:$0.00}.
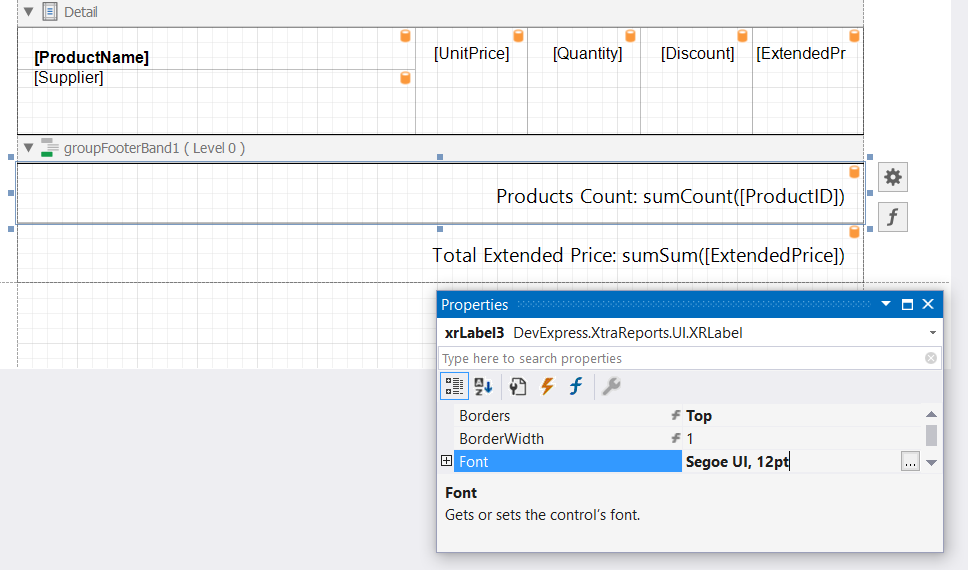
Customize the appearance of labels. In this tutorial, we use the following settings for the labels to make them look similar to the report appearance:
Property | Value |
|---|---|
| MiddleRight |
| 2, 15, 0, 0 |
| Segoe UI, 12pt |
Switch to the Preview tab and set the Order ID parameter value to 10926. The first page of the generated report document contains products with regular prices, and the summaries for the products are displayed at the page bottom.
Similarly, the second page includes the list of expensive products and their summaries.
Summary
In this tutorial, we explained how to group report data and calculate group summaries. We also covered the basics of calculated fields. For more information on these subjects, refer to the following documentation sections:
In the next tutorial, we will explain how to add the navigation functionality to the report. Refer to the following topic for instructions: Tutorial 6 - Add Navigation to a Report.