HeatmapDensityBasedAlgorithm Class
The algorithm that allows the Map Control to plot a heatmap based on the density of heatmap points.
Namespace: DevExpress.XtraMap
Assembly: DevExpress.XtraMap.v25.1.dll
NuGet Package: DevExpress.Win.Map
Declaration
public class HeatmapDensityBasedAlgorithm :
    HeatmapAlgorithmBase,
    IDensityBasedAlgorithm,
IHeatmapAlgorithmRemarks
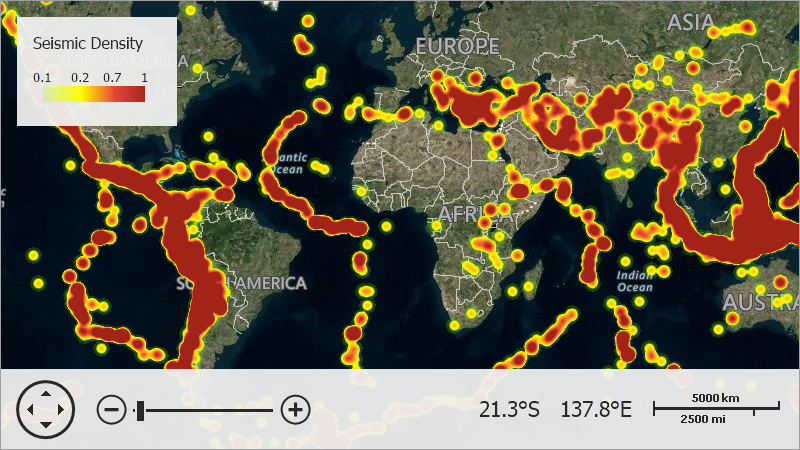
When you use the HeatmapDensityBasedAlgorithm to create a heatmap, the Map Control aggregates points into areas of different colors. An area with high point density is painted red. A green area indicates that this region contains a low number of points. The Map Control re-aggregates heatmap points when you zoom in/out a map. For this reason, areas of aggregated points can change their colors.

To change the predefined color scheme, specify the HeatmapProvider.Colorizer property. The first item in the ChoroplethColorizer.ColorItems collection defines a color for areas with low point density, the last item specifies the color of areas with high point density.
Example
This example shows how to create a heatmap layer for the Map Control.
- Create an ImageLayer object and add it to the MapControl.Layers collection.
- Assign a HeatmapProvider object to the ImageLayer.DataProvider property.
using DevExpress.XtraMap;
using System;
using System.Data;
using System.Drawing;
using System.Windows.Forms;

namespace HeatMapSample {
    public partial class Form1 : Form {
        public Form1() {
            InitializeComponent();
        }
        private void Form1_Load(object sender, EventArgs e) {

            ImageLayer bingLayer = new ImageLayer();
            bingLayer.DataProvider = new BingMapDataProvider { BingKey = "Your Bing Maps key here." };
            mapControl1.Layers.Add(bingLayer);

            ChoroplethColorizer colorizer = new ChoroplethColorizer();
            colorizer.RangeStops.AddRange(new double[] { 0.1, 0.2, 0.7, 1 });
            colorizer.ColorItems.Add(new ColorizerColorItem(Color.FromArgb(50, 128, 255, 0)));
            colorizer.ColorItems.Add(new ColorizerColorItem(Color.FromArgb(255, 255, 255, 0)));
            colorizer.ColorItems.Add(new ColorizerColorItem(Color.FromArgb(255, 234, 72, 58)));
            colorizer.ColorItems.Add(new ColorizerColorItem(Color.FromArgb(255, 162, 36, 25)));
            colorizer.ApproximateColors = true;

            HeatmapDataSourceAdapter adapter = new HeatmapDataSourceAdapter();
            adapter.Mappings.XCoordinate = "glon"; // The data source field name that provides x-coordinates.
            adapter.Mappings.YCoordinate = "glat"; // The data source field name that provides y-coordinates.
            adapter.DataSource = LoadData("../../Data/Earthquakes.xml", "Row");

            HeatmapProvider provider = new HeatmapProvider();
            provider.PointSource = adapter;
            provider.Algorithm = new HeatmapDensityBasedAlgorithm { PointRadius = 8 };
            provider.Colorizer = colorizer;

            ImageLayer heatmapLayer = new ImageLayer();
            heatmapLayer.DataProvider = provider;
            mapControl1.Layers.Add(heatmapLayer);

            ColorScaleLegend legend = new ColorScaleLegend();
            legend.Header = "Seismic Density";
            legend.EnableGradientScale = true;
            legend.Layer = heatmapLayer;
            legend.HeaderStyle.Font = new Font("Tahoma", 12F);
            mapControl1.Legends.Add(legend);
        }
        DataTable LoadData(string filePath, string tableName) {
            DataSet xmlDataSet = new DataSet("XML DataSet");
            xmlDataSet.ReadXml(filePath);
            return xmlDataSet.Tables[tableName];
        }
    }
}