Lesson 2 - Bind a Pivot Grid to an OLAP Cube
- 2 minutes to read
A cube is a multidimensional structure defined by its measures and dimensions. You can think of a measure as a data field in the PivotGridControl, while a dimension can be represented by a column, filter, or row field. This tutorial will help you learn how to bind a pivot grid to an existing OLAP (OnLine Analytical Processing) cube. In this example, we will use the Adventure Works cube.
To display data from an OLAP cube, do the following.
- Run MS Visual Studio. Create a new Windows Forms Application project and add the PivotGridControl as you did in Lesson 1, Steps 1-4.
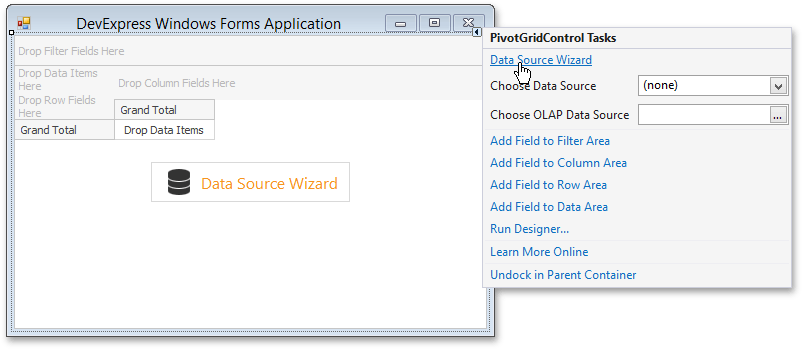
Click the smart tag icon (
 ) displayed at the top-right of the pivot grid to invoke the popup PivotGridControl Tasks window.
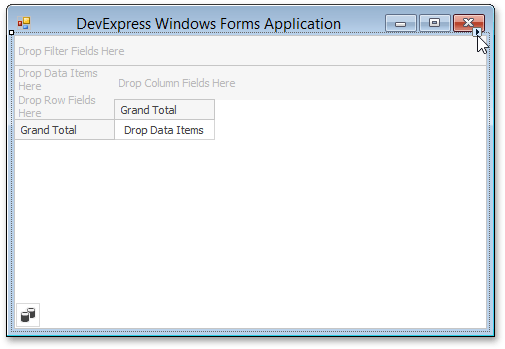
In this window, select the Data Source Wizard item.
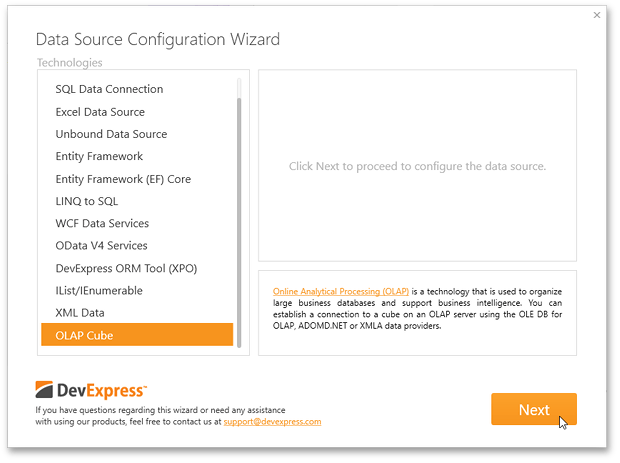
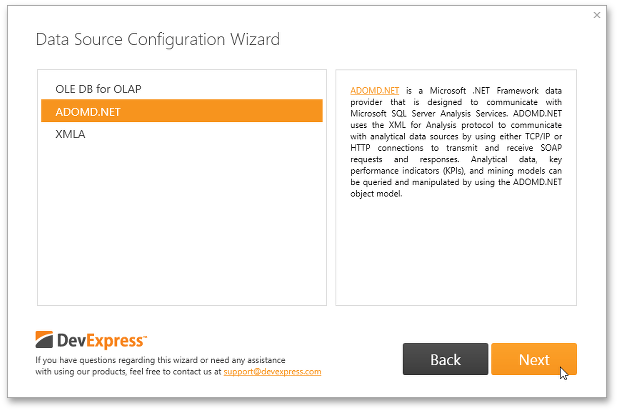
In the invoked wizard, select the OLAP Cube technology and click Next.
Select ADOMD.NET as a data provider and click Next.
In the next window, select the MSOLAP provider and specify the Server Name as https://demos.devexpress.com/Services/OLAP/msmdpump.dll. Then, click the Retrieve Schema button.
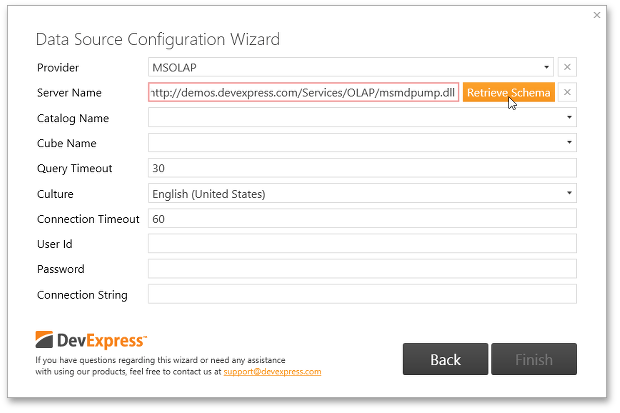
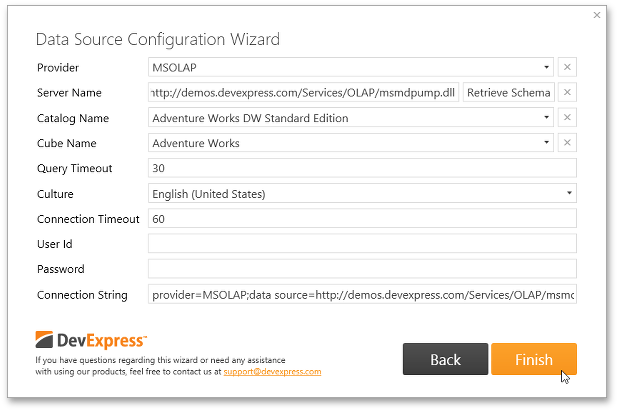
Make sure that the following parameters are specified.
Provider
MSOLAP
Identifies the data provider to be used. The “MSOLAP“ string identifies the latest version of the OLE DB provider.
Server Name
https://demos.devexpress.com/Services/OLAP/msmdpump.dll
Specifies either the name of a server that runs an instance of Microsoft SQL Server Analysis Services (SSAS), the path to a cube file, or the path to a data pump.
Catalog Name
Adventure Works DW Standard Edition
Specifies a data catalog that contains cubes.
Cube Name
Adventure Works
Specifies the name of a cube that provides OLAP data.
The image below demonstrates configured settings of the OLAP connection. Click Finish to close the wizard.
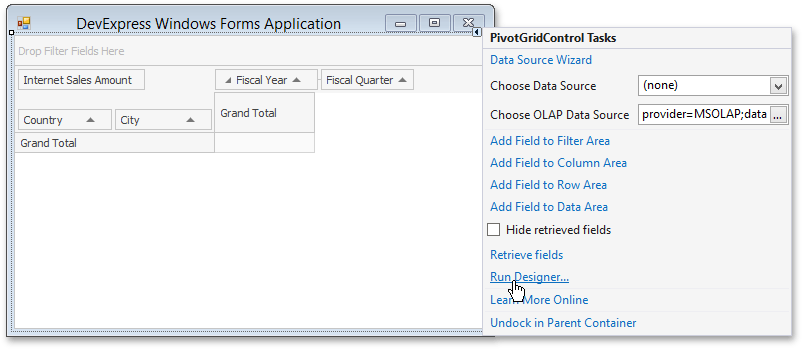
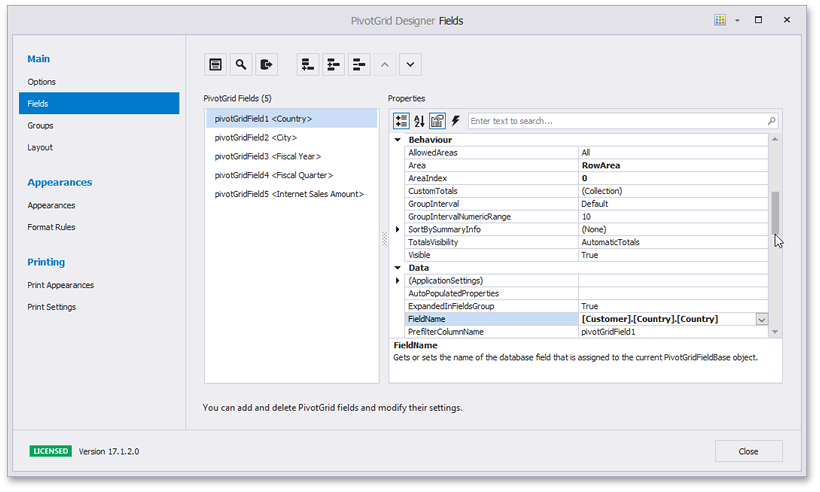
In PivotGridControl, create fields that represent specific measures and dimension levels of the cube.
Click the smart tag icon and then click Run Designer… in the popup window.
In the invoked PivotGrid Designer, add five fields using the
 button and specify their FieldName, Area, and AreaIndex properties as shown below.
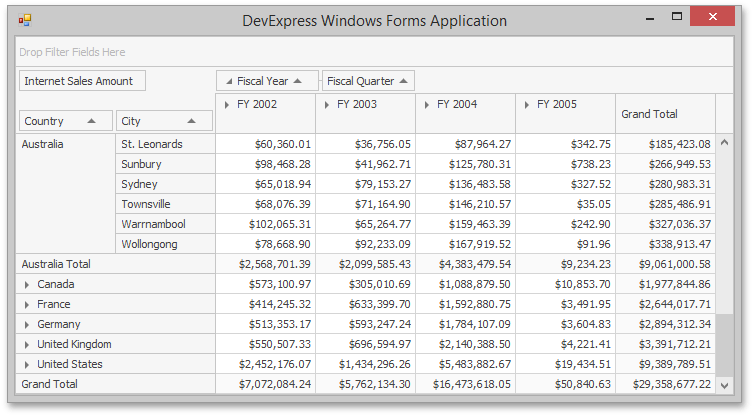
FieldName Area AreaIndex [Customer].[Country].[Country] RowArea 0 [Customer].[City].[City] RowArea 1 [Date].[Fiscal].[Fiscal Year] ColumnArea 0 [Date].[Fiscal].[Fiscal Quarter] ColumnArea 1 [Measures].[Internet Sales Amount] DataArea 0 The image below shows the result.
Close the designer. The pivot grid fields should be arranged as illustrated below.
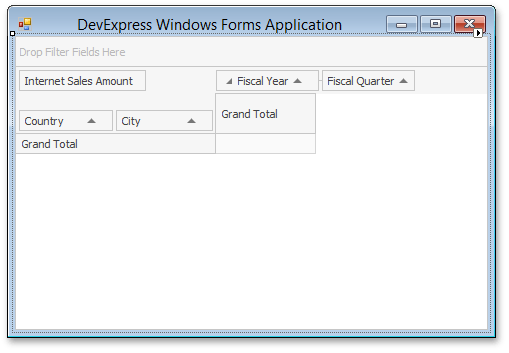
Result
Run the project to see the result.