ManualNumericScaleOptions.MeasureUnit Property
Gets or sets the detail level for numeric values.
Namespace: DevExpress.Xpf.Charts
Assembly: DevExpress.Xpf.Charts.v21.2.dll
NuGet Package: DevExpress.Wpf.Charts
Declaration
Property Value
| Type | Description |
|---|---|
| Double | A Double value which represents the axis’ detail level. |
Remarks
This property is available when one of the AxisX2D.NumericScaleOptions, AxisX3D.NumericScaleOptions or CircularAxisX2D.NumericScaleOptions properties is set to ManualNumericScaleOptions.
The table below shows the MeasureUnit property in action for random data.
| ManualNumericScaleOptions.MeasureUnit = 100 | ManualNumericScaleOptions.MeasureUnit = 1000 |
|---|---|
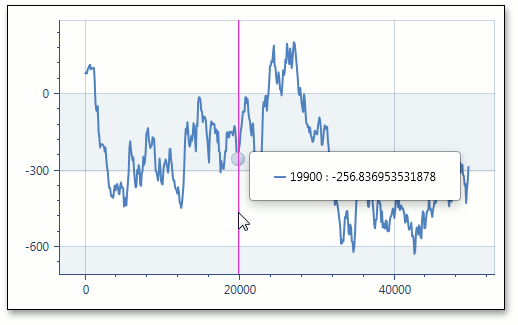 |
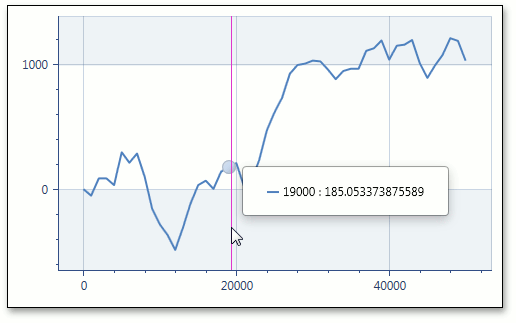 |
To define a numeric measurement unit to which the beginning of a diagram’s grid lines and axis labels should be aligned, use the ManualNumericScaleOptions.GridAlignment property.
To learn more, see Data Aggregation.
Example
This example demonstrates how to use the manual numeric scale options of the X-axis.
When the AxisX2D.NumericScaleOptions property is set to ManualNumericScaleOptions, you can manually define the ManualNumericScaleOptions.GridAlignment, ManualNumericScaleOptions.MeasureUnit and ManualNumericScaleOptions.AggregateFunction properties.
To use the automatic numeric scale options, set the AxisX2D.NumericScaleOptions property to AutomaticNumericScaleOptions and choose the appropriate AutomaticNumericScaleOptions.AggregateFunction.
To prevent the axis scale from being divided into intervals (and thus prevent chart data from being aggregated), set the ManualNumericScaleOptions.AggregateFunction or AutomaticNumericScaleOptions.AggregateFunction property to None.
<Window
        xmlns="http://schemas.microsoft.com/winfx/2006/xaml/presentation"
        xmlns:x="http://schemas.microsoft.com/winfx/2006/xaml"
        xmlns:dxc="http://schemas.devexpress.com/winfx/2008/xaml/charts"
    x:Class="AggregationNumericData.MainWindow"
        Title="MainWindow" Height="350" Width="525">
    <Grid>
        <dxc:ChartControl >
            <dxc:ChartControl.Legend>
                <dxc:Legend/>
            </dxc:ChartControl.Legend>
            <dxc:XYDiagram2D>
                <dxc:XYDiagram2D.AxisX>
                    <dxc:AxisX2D GridLinesVisible="True">
                        <dxc:AxisX2D.NumericScaleOptions>
                            <dxc:ManualNumericScaleOptions MeasureUnit="100" GridAlignment="1000"
                                                           AggregateFunction="Maximum" GridSpacing="2"/>
                        </dxc:AxisX2D.NumericScaleOptions>
                    </dxc:AxisX2D>
                </dxc:XYDiagram2D.AxisX>
                <dxc:LineSeries2D DataSource="{Binding Path=Series}"
                                  ArgumentDataMember="Argument" ValueDataMember="Value"/>
            </dxc:XYDiagram2D>
        </dxc:ChartControl>
    </Grid>
</Window>