Legend Class
Represents a chart control’s legend.
Namespace: DevExpress.Xpf.Charts
Assembly: DevExpress.Xpf.Charts.v21.2.dll
NuGet Package: DevExpress.Wpf.Charts
Declaration
Related API Members
The following members return Legend objects:
Remarks
An object of the Legend type is stored in a Chart control using the ChartControlBase.Legends property.
The legend identifies chart elements by markers coupled with text.
A series (or, its points) is represented in legend, if the Series.ShowInLegend property is enabled. To also be listed in legend, other elements (constant lines and strips) should have their LegendText property defined (ConstantLine.LegendText or Strip.LegendText).
To control a legend’s alignment within a chart, use the LegendBase.HorizontalPosition and LegendBase.VerticalPosition properties. To maintain a regular indent between the legend and the diagram, use the LegendBase.IndentFromDiagram property.
A legend title items can be specified using the LegendBase.Title and LegendBase.CustomItems properties.
A legend and its items are customized using the LegendBase.ItemsPanel, LegendBase.ItemTemplate and Legend.ReverseItems properties.
Example
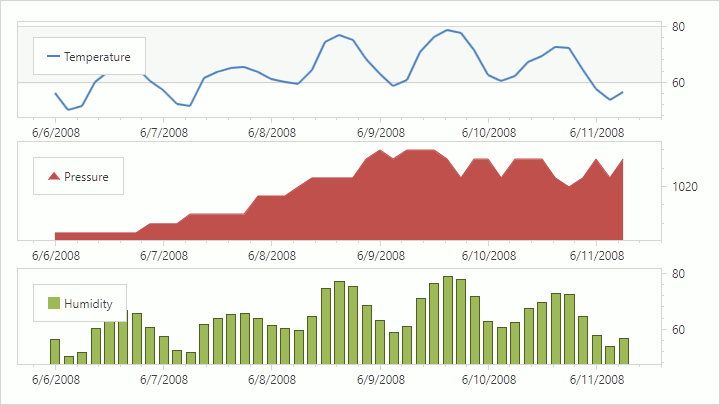
This example illustrates how to assign the chart control’s panes, axes, and legends to series:
Important
The series can use only elements that are defaults (for example, XYDiagram2D.AxisY or stored in element collections (for example, ChartControlBase.Legends). Do not assign new elements to series properties.
Markup:
<Window x:Class="LegendSample.MainWindow"
        xmlns="http://schemas.microsoft.com/winfx/2006/xaml/presentation"
        xmlns:x="http://schemas.microsoft.com/winfx/2006/xaml"
        xmlns:d="http://schemas.microsoft.com/expression/blend/2008"
        xmlns:mc="http://schemas.openxmlformats.org/markup-compatibility/2006"
        xmlns:dxc="http://schemas.devexpress.com/winfx/2008/xaml/charts"
        xmlns:viewmodel="clr-namespace:LegendSample.ViewModel"
        mc:Ignorable="d"
        Title="MainWindow" Height="720" Width="1280">
    <Window.DataContext>
        <viewmodel:WeatherViewModel/>
    </Window.DataContext>
    <Window.Resources>
        <Style TargetType="dxc:Range">
            <Setter Property="dxc:AxisY2D.AlwaysShowZeroLevel"
                    Value="False"/>
        </Style>
        <Style TargetType="dxc:Legend">
            <Setter Property="HorizontalPosition"
                    Value="Left"/>
        </Style>
    </Window.Resources>
    <Grid>
        <dxc:ChartControl DataSource="{Binding WeatherItems}" AutoLayout="False">
            <dxc:ChartControl.Legends>
                <dxc:Legend x:Name="temperatureLegend"
                            DockTarget="{Binding ElementName=temperaturePane}"/>
                <dxc:Legend x:Name="pressureLegend"
                            DockTarget="{Binding ElementName=pressurePane}"/>
                <dxc:Legend x:Name="humidityLegend"
                            DockTarget="{Binding ElementName=humidityPane}"/>
            </dxc:ChartControl.Legends>
            <dxc:ChartControl.Diagram>
                <dxc:XYDiagram2D>
                    <dxc:XYDiagram2D.AxisX>
                        <dxc:AxisX2D>
                            <dxc:AxisX2D.DateTimeScaleOptions>
                                <dxc:ManualDateTimeScaleOptions MeasureUnit="Hour"
                                                                MeasureUnitMultiplier="1"/>
                            </dxc:AxisX2D.DateTimeScaleOptions>
                        </dxc:AxisX2D>
                    </dxc:XYDiagram2D.AxisX>
                    <dxc:XYDiagram2D.AxisY>
                        <dxc:AxisY2D x:Name="temperatureAxisY"
                                     Alignment="Far"/>
                    </dxc:XYDiagram2D.AxisY>
                    <dxc:XYDiagram2D.DefaultPane>
                        <dxc:Pane x:Name="temperaturePane"/>
                    </dxc:XYDiagram2D.DefaultPane>
                    <dxc:XYDiagram2D.Panes>
                        <dxc:Pane x:Name="pressurePane"/>
                        <dxc:Pane x:Name="humidityPane"/>
                    </dxc:XYDiagram2D.Panes>
                    <dxc:XYDiagram2D.SecondaryAxesY>
                        <dxc:SecondaryAxisY2D x:Name="pressureAxisY"/>
                        <dxc:SecondaryAxisY2D x:Name="humidityAxisY"/>
                    </dxc:XYDiagram2D.SecondaryAxesY>
                    <dxc:XYDiagram2D.Series>
                        <dxc:LineSeries2D DisplayName="Temperature"
                                          ArgumentDataMember="DateTime" ValueDataMember="Temperature"
                                          AxisY="{Binding ElementName=temperatureAxisY}"
                                          Legend="{Binding ElementName=temperatureLegend}"
                                          Pane="{Binding ElementName=temperaturePane}"/>
                        <dxc:AreaSeries2D DisplayName="Pressure"
                                          ArgumentDataMember="DateTime" ValueDataMember="Pressure"
                                          AxisY="{Binding ElementName=pressureAxisY}"
                                          Legend="{Binding ElementName=pressureLegend}"
                                          Pane="{Binding ElementName=pressurePane}"/>
                        <dxc:BarSideBySideSeries2D DisplayName="Humidity"
                                                   BarWidth="2"
                                                   ArgumentDataMember="DateTime" ValueDataMember="Temperature"
                                                   AxisY="{Binding ElementName=humidityAxisY}"
                                                   Legend="{Binding ElementName=humidityLegend}"
                                                   Pane="{Binding ElementName=humidityPane}"/>
                    </dxc:XYDiagram2D.Series>
                </dxc:XYDiagram2D>
            </dxc:ChartControl.Diagram>
        </dxc:ChartControl>
    </Grid>
</Window>
Code-Behind:
class WeatherItem {
    public DateTime DateTime { get; }
    public double Temperature { get; }
    public double Pressure { get; }
    public double Humidity { get; }

    public WeatherItem(DateTime dateTime, double temperature, double pressure, double humidity) {
        this.DateTime = dateTime;
        this.Temperature = temperature;
        this.Pressure = pressure;
        this.Humidity = humidity;
    }
}

class WeatherViewModel {
    public IReadOnlyList<WeatherItem> WeatherItems { get; }

    public WeatherViewModel() {
        WeatherItems = new List<WeatherItem> {
            new WeatherItem(new DateTime(2008, 6, 11, 6, 0, 0, 0),  56.48, 1023, 69),
            new WeatherItem(new DateTime(2008, 6, 11, 3, 0, 0, 0),  53.78, 1021, 76),
            new WeatherItem(new DateTime(2008, 6, 11, 0, 0, 0, 0),  57.74, 1023, 66),
            new WeatherItem(new DateTime(2008, 6, 10, 21, 0, 0, 0), 64.40, 1021, 49),
            new WeatherItem(new DateTime(2008, 6, 10, 18, 0, 0, 0), 72.50, 1020, 45),
            new WeatherItem(new DateTime(2008, 6, 10, 15, 0, 0, 0), 72.68, 1021, 48),
            new WeatherItem(new DateTime(2008, 6, 10, 12, 0, 0, 0), 69.62, 1023, 57),
            new WeatherItem(new DateTime(2008, 6, 10, 9, 0, 0, 0),  67.28, 1023, 66),
            new WeatherItem(new DateTime(2008, 6, 10, 6, 0, 0, 0),  62.42, 1023, 78),
            new WeatherItem(new DateTime(2008, 6, 10, 3, 0, 0, 0),  60.62, 1021, 83),
            new WeatherItem(new DateTime(2008, 6, 10, 0, 0, 0, 0),  62.60, 1023, 72),
            new WeatherItem(new DateTime(2008, 6, 9, 21, 0, 0, 0),  71.96, 1023, 52),
            new WeatherItem(new DateTime(2008, 6, 9, 18, 0, 0, 0),  77.90, 1021, 40),
            new WeatherItem(new DateTime(2008, 6, 9, 15, 0, 0, 0),  78.98, 1023, 41),
            new WeatherItem(new DateTime(2008, 6, 9, 12, 0, 0, 0),  76.28, 1024, 37),
            new WeatherItem(new DateTime(2008, 6, 9, 9, 0, 0, 0),   71.06, 1024, 41),
            new WeatherItem(new DateTime(2008, 6, 9, 6, 0, 0, 0),   60.80, 1024, 68),
            new WeatherItem(new DateTime(2008, 6, 9, 3, 0, 0, 0),   58.64, 1023, 78),
            new WeatherItem(new DateTime(2008, 6, 9, 0, 0, 0, 0),   63.14, 1024, 71),
            new WeatherItem(new DateTime(2008, 6, 8, 21, 0, 0, 0),  68.54, 1023, 63),
            new WeatherItem(new DateTime(2008, 6, 8, 18, 0, 0, 0),  75.20, 1021, 47),
            new WeatherItem(new DateTime(2008, 6, 8, 15, 0, 0, 0),  77.18, 1021, 44),
            new WeatherItem(new DateTime(2008, 6, 8, 12, 0, 0, 0),  74.48, 1021, 48),
            new WeatherItem(new DateTime(2008, 6, 8, 9, 0, 0, 0),   64.58, 1021, 68),
            new WeatherItem(new DateTime(2008, 6, 8, 6, 0, 0, 0),   59.36, 1020, 81),
            new WeatherItem(new DateTime(2008, 6, 8, 3, 0, 0, 0),   60.08, 1019, 85),
            new WeatherItem(new DateTime(2008, 6, 8, 0, 0, 0, 0),   61.16, 1019, 76),
            new WeatherItem(new DateTime(2008, 6, 7, 21, 0, 0, 0),  63.86, 1019, 65),
            new WeatherItem(new DateTime(2008, 6, 7, 18, 0, 0, 0),  65.66, 1017, 57),
            new WeatherItem(new DateTime(2008, 6, 7, 15, 0, 0, 0),  65.12, 1017, 62),
            new WeatherItem(new DateTime(2008, 6, 7, 12, 0, 0, 0),  63.86, 1017, 53),
            new WeatherItem(new DateTime(2008, 6, 7, 9, 0, 0, 0),   61.52, 1017, 62),
            new WeatherItem(new DateTime(2008, 6, 7, 6, 0, 0, 0),   51.80, 1017, 76),
            new WeatherItem(new DateTime(2008, 6, 7, 3, 0, 0, 0),   52.34, 1016, 80),
            new WeatherItem(new DateTime(2008, 6, 7, 0, 0, 0, 0),   57.20, 1016, 82),
            new WeatherItem(new DateTime(2008, 6, 6, 21, 0, 0, 0),  60.44, 1016, 73),
            new WeatherItem(new DateTime(2008, 6, 6, 18, 0, 0, 0),  65.48, 1015, 57),
            new WeatherItem(new DateTime(2008, 6, 6, 15, 0, 0, 0),  66.56, 1015, 55),
            new WeatherItem(new DateTime(2008, 6, 6, 12, 0, 0, 0),  64.04, 1015, 64),
            new WeatherItem(new DateTime(2008, 6, 6, 9, 0, 0, 0),   60.26, 1015, 74),
            new WeatherItem(new DateTime(2008, 6, 6, 6, 0, 0, 0),   51.44, 1015, 89),
            new WeatherItem(new DateTime(2008, 6, 6, 3, 0, 0, 0),   50.18, 1015, 87),
            new WeatherItem(new DateTime(2008, 6, 6, 0, 0, 0, 0),   56.12, 1015, 80)
        };
    }
}
The following properties allow you to configure chart elements to series binding:
| Symbol | Description |
|---|---|
| Series.Legend | Specifies a legend (or its View Model) that contains the series’ legend item. |
| XYSeries2D.AxisX | Specifies the X-axis (or its View Model) that measures the series. |
| XYSeries2D.AxisY | Specifies the Y-axis (or its View Model) that measures a series. |
| XYSeries2D.Pane | Specifies the pane (or its View Model) on which the series is plotted. |
| ChartControlBase.Legends | Returns the collection of chart legends. |
| XYDiagram2D.AxisX | Gets the X-axis. |
| XYDiagram2D.AxisY | Gets the Y-axis. |
| XYDiagram2D.DefaultPane | Provides access to a default pane object. |
| XYDiagram2D.SecondaryAxesX | Gets the collection of secondary X-axes. |
| XYDiagram2D.SecondaryAxesY | Gets the collection of secondary Y-axes. |
| XYDiagram2D.Panes | Provides access to the diagram‘s pane collection. |
Related GitHub Examples
The following code snippets (auto-collected from DevExpress Examples) contain references to the Legend class.
Note
The algorithm used to collect these code examples remains a work in progress. Accordingly, the links and snippets below may produce inaccurate results. If you encounter an issue with code examples below, please use the feedback form on this page to report the issue.