ManualDateTimeScaleOptions.AutoGrid Property
Gets or sets a value that specifies whether the spacing of grid lines is calculated automatically based upon the major tickmarks of the axis.
Namespace: DevExpress.Xpf.Charts
Assembly: DevExpress.Xpf.Charts.v19.2.dll
Declaration
Property Value
| Type | Description |
|---|---|
| Boolean | true, if grid spacing is performed automatically; otherwise, false. |
Remarks
The AutoGrid property is tightly interrelated to the ManualDateTimeScaleOptions.GridSpacing property. Changing the value of one property affects the other. By default, the AutoGrid property is set to true and the grid line spacing is calculated automatically.
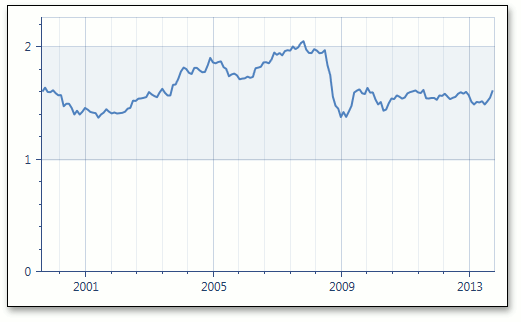
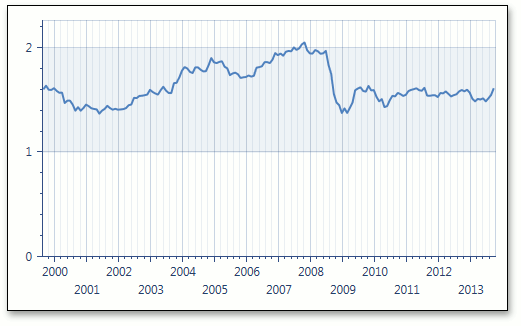
The following images demonstrate how the AutoGrid property works.
AutoGrid = true, GridSpacing=4 | AutoGrid = false, GridSpacing=1 |
|---|---|
|
|
Example
This example demonstrates how to use the manual date-time scale options of the X-axis.
Data aggregation is enabled automatically for the date-time scale on the X-axis in both automatic and manual scale options.
When the AxisX2D.DateTimeScaleOptions property is set to ManualDateTimeScaleOptions, you can define the ManualDateTimeScaleOptions.GridAlignment, ManualDateTimeScaleOptions.MeasureUnit and ManualDateTimeScaleOptions.AggregateFunction properties manually.
To use the automatic date-time scale options, set the AxisX2D.DateTimeScaleOptions property to AutomaticDateTimeScaleOptions, and select the appropriate AutomaticDateTimeScaleOptions.AggregateFunction.
To prevent the axis scale from being divided into intervals (and thus prevent chart data from being aggregated), set the ManualDateTimeScaleOptions.AggregateFunction property to None.
Note
A complete sample project is available at https://github.com/DevExpress-Examples/how-to-use-manual-date-time-scale-options-of-an-axis-t112240.
<Window
        xmlns="http://schemas.microsoft.com/winfx/2006/xaml/presentation"
        xmlns:x="http://schemas.microsoft.com/winfx/2006/xaml"
        xmlns:dxc="http://schemas.devexpress.com/winfx/2008/xaml/charts"
        x:Class="WpfApplication19.MainWindow"
        Title="MainWindow" Height="400" Width="525">
    <Grid>
        <dxc:ChartControl>
            <dxc:XYDiagram2D >
                <dxc:XYDiagram2D.AxisX>
                    <dxc:AxisX2D GridLinesMinorVisible="True" GridLinesVisible="True">
                        <dxc:AxisX2D.DateTimeScaleOptions>
                            <dxc:ManualDateTimeScaleOptions AggregateFunction="Maximum" AutoGrid="False"
                                                            GridAlignment="Year" MeasureUnit="Month"
                                                            GridSpacing="3" GridOffset="1"/>
                        </dxc:AxisX2D.DateTimeScaleOptions>
                    </dxc:AxisX2D>
                </dxc:XYDiagram2D.AxisX>
                <dxc:LineSeries2D DataSource="{Binding Path=Rate}"
                                  ArgumentDataMember="Argument" ValueDataMember="Value"  />
            </dxc:XYDiagram2D>
        </dxc:ChartControl>
    </Grid>
</Window>
Related GitHub Examples
The following code snippets (auto-collected from DevExpress Examples) contain references to the AutoGrid property.
Note
The algorithm used to collect these code examples remains a work in progress. Accordingly, the links and snippets below may produce inaccurate results. If you encounter an issue with code examples below, please use the feedback form on this page to report the issue.