BarSeries3D Class
Represents the 3D Manhattan Bar series.
Namespace: DevExpress.Xpf.Charts
Assembly: DevExpress.Xpf.Charts.v19.2.dll
Declaration
Example
This example demonstrates how to create a 3D Manhattan Bar chart.
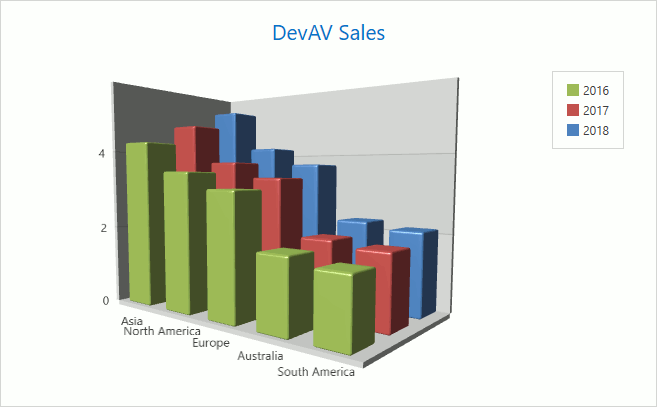
Create a ChartControl and specify its ChartControl.Diagram property to a XYDiagram3D object.
Note
Note that the ChartControl.Diagram is a content property. You can declare a diagram in XAML directly after a chart control’s declaration and not wrap it in opening and closing ChartControl.Diagram tags.
Add a
BarSeries3Dobject to the Diagram.Series collection.Note
Note that the Diagram.Series is a content property. You can declare series in XAML directly after a diagram’s declaration and not wrap it in opening and closing Diagram.Series tags.
Use the following properties to bind the series to data:
- Series.DataSource - Specifies the series’s data source.
- Series.ArgumentDataMember - Defines the data member that provides the series’s arguments.
- Series.ValueDataMember - Specifies the data member that provides the series’s values.
Note
A complete sample project is available at https://github.com/DevExpress-Examples/how-to-create-a-3d-manhattan-bar-chart-e1694.
<Window x:Class="ManhattanBar3DChart.Window1"
        xmlns:local="clr-namespace:ManhattanBar3DChart"
        xmlns="http://schemas.microsoft.com/winfx/2006/xaml/presentation"
        xmlns:x="http://schemas.microsoft.com/winfx/2006/xaml"
        xmlns:dxc="http://schemas.devexpress.com/winfx/2008/xaml/charts"
        Title="Main Window" Height="492" Width="851.5">
    <Grid>
        <dxc:ChartControl Name="chartControl1">
            <dxc:ChartControl.DataContext>
                <local:DevAVSalesByYear/>
            </dxc:ChartControl.DataContext>
            <dxc:XYDiagram3D BarDistance="0.3"
                             BarDistanceFixed="5"
                             SeriesDistance="1"
                             ZoomPercent="140"
                             HorizontalScrollPercent="-10"
                             VerticalScrollPercent="10">
                <dxc:XYDiagram3D.ContentTransform>
                    <MatrixTransform3D>
                        <MatrixTransform3D.Matrix>
                            <Matrix3D M11="0.82" M12="-0.06" M13="0.575" M14="0"
                                      M21="0.01" M22="1" M23="0.089" M24="0"
                                      M31="-0.578" M32="-0.067" M33="0.813" M34="0"
                                      M44="1"
                                      OffsetZ="0" OffsetX="0" OffsetY="0"/>
                        </MatrixTransform3D.Matrix>
                    </MatrixTransform3D>
                </dxc:XYDiagram3D.ContentTransform>
                <dxc:BarSeries3D
                        x:Name="series1"
                        DisplayName="{Binding Series1DisplayName}"
                        DataSource="{Binding Series1Source}"
                        ArgumentDataMember="Region"
                        ValueDataMember="Sales"/>
                <dxc:BarSeries3D
                        x:Name="series2"
                        DisplayName="{Binding Series2DisplayName}"
                        DataSource="{Binding Series2Source}"
                        ArgumentDataMember="Region"
                        ValueDataMember="Sales"/>
                <dxc:BarSeries3D
                        x:Name="series3"
                        DisplayName="{Binding Series3DisplayName}"
                        DataSource="{Binding Series3Source}"
                        ArgumentDataMember="Region"
                        ValueDataMember="Sales"/>
            </dxc:XYDiagram3D>
            <dxc:ChartControl.Legends>
                <dxc:Legend
                    HorizontalPosition="Right"
                    ReverseItems="True" />
            </dxc:ChartControl.Legends>
            <dxc:ChartControl.Titles>
                <dxc:Title Content="DevAV Sales"
                           Dock="Top"
                           HorizontalAlignment="Center"/>
            </dxc:ChartControl.Titles>
        </dxc:ChartControl>
    </Grid>
</Window>
Related GitHub Examples
The following code snippets (auto-collected from DevExpress Examples) contain references to the BarSeries3D class.
Note
The algorithm used to collect these code examples remains a work in progress. Accordingly, the links and snippets below may produce inaccurate results. If you encounter an issue with code examples below, please use the feedback form on this page to report the issue.