PieSeries2D Class
Represents the 2D Pie (Donut) series.
Namespace: DevExpress.Xpf.Charts
Assembly: DevExpress.Xpf.Charts.v19.2.dll
Declaration
Example
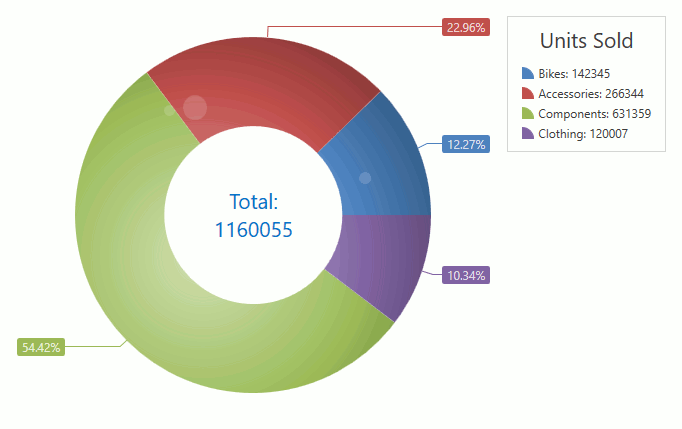
This example demonstrates how to create a 2D Pie chart.
Create a ChartControl and specify its ChartControl.Diagram property to a SimpleDiagram2D object.
Note
Note that the ChartControl.Diagram is a content property. You can declare a diagram in XAML directly after a chart control’s declaration without wrapping it in opening and closing ChartControl.Diagram tags.
Add a PieSeries2D object to the Diagram.Series collection.
Note
Note that the Diagram.Series is a content property. You can declare series in XAML directly after a diagram’s declaration without wrapping them in opening and closing Diagram.Series tags.
Use the following properties to bind the series to data:
- Series.DataSource - Specifies the series’s data source.
- Series.ArgumentDataMember - Defines the data member that provides the series’s arguments.
- Series.ValueDataMember - Specifies the data member that provides the series’s values.
The PieSeries2D.Model property allows you to change the series appearance using the built-in models. This example uses the GlarePie2DModel model.
Use the Series.LegendTextPattern property to specify how to format text that identifies series points in the legend.
Set the Series.LabelsVisibility property to true to display the series’s labels. The SeriesLabel.TextPattern property defines how to configure series labels’ text.
The PieTotalLabel.TextPattern property allows you to specify the center label’s content.
Note
A complete sample project is available at GitHub.
<Window x:Class="PieDonut2DChart.Window1"
xmlns="http://schemas.microsoft.com/winfx/2006/xaml/presentation"
xmlns:x="http://schemas.microsoft.com/winfx/2006/xaml"
xmlns:dxc="http://schemas.devexpress.com/winfx/2008/xaml/charts"
xmlns:local="clr-namespace:PieDonut2DChart"
Title="Window1" Height="470" Width="700">
<Window.DataContext>
<local:ChartViewModel/>
</Window.DataContext>
<Grid>
<dxc:ChartControl Name="chartControl">
<dxc:SimpleDiagram2D>
<dxc:PieSeries2D x:Name="series"
DisplayName="Sales"
DataSource="{Binding Path=Data}"
ArgumentDataMember="Argument"
ValueDataMember="Value"
LabelsVisibility="True"
LegendTextPattern="{}{A}: {V}"
HoleRadiusPercent="50">
<!--region #Model-->
<dxc:PieSeries2D.Model>
<dxc:GlarePie2DModel/>
</dxc:PieSeries2D.Model>
<!--endregion #Model-->
<dxc:PieSeries2D.TotalLabel>
<dxc:PieTotalLabel TextPattern="Total:
{TV}"/>
</dxc:PieSeries2D.TotalLabel>
<dxc:PieSeries2D.Label>
<dxc:SeriesLabel TextPattern="{}{VP:P}"
dxc:PieSeries.LabelPosition="TwoColumns"/>
</dxc:PieSeries2D.Label>
</dxc:PieSeries2D>
</dxc:SimpleDiagram2D>
<dxc:ChartControl.Legends>
<dxc:Legend>
<dxc:Legend.Title>
<dxc:LegendTitle Content="Units Sold"/>
</dxc:Legend.Title>
</dxc:Legend>
</dxc:ChartControl.Legends>
</dxc:ChartControl>
</Grid>
</Window>
Related GitHub Examples
The following code snippets (auto-collected from DevExpress Examples) contain references to the PieSeries2D class.
Note
The algorithm used to collect these code examples remains a work in progress. Accordingly, the links and snippets below may produce inaccurate results. If you encounter an issue with code examples below, please use the feedback form on this page to report the issue.