FunnelSeries2D.HeightToWidthRatioAuto Property
Gets or sets a value which indicates whether the height-to-width ratio of a Funnel Series series should be auto-calculated.
Namespace: DevExpress.Xpf.Charts
Assembly: DevExpress.Xpf.Charts.v18.2.dll
Declaration
Property Value
| Type | Description |
|---|---|
| Boolean | true, if the height-to-width ratio should be auto-calculated; otherwise, false. |
Remarks
Use the HeightToWidthRatioAuto property, to toggle between automatic and manual height-to-width ratio definition for Funnel Series series.
If the HeightToWidthRatioAuto property is set to false, the FunnelSeries2D.HeightToWidthRatio property becomes available, which allows you to manually define the desired ratio.
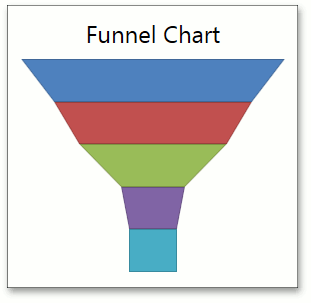
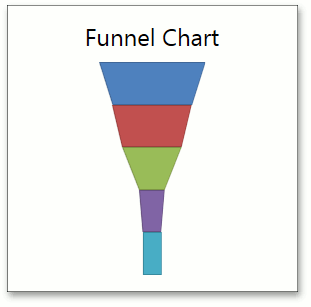
The following images demonstrate the HeightToWidthRatioAuto property in action.
HeightToWidthRatioAuto = true | HeightToWidthRatioAuto = false HeightToWidthRatio = 2 |
|---|---|
|
|
Example
The following example demonstrates how to create a 2D Funnel chart.
For this, it’s necessary to create a ChartControl, choose a SimpleDiagram2D object as its diagram and put FunnelSeries2D into its SeriesCollection. Each point of a funnel series should contain an argument and a value.
Note that in this sample the label’s SeriesLabel.TextPattern and Series.LegendTextPattern properties are set to “{}{A}: {VP: ##.##%}”, which allows showing a point’s argument and its percentage value separated by a colon. The available placeholders are detailed below.
- {A} - Use it to display a series point’s arguments.
- {VP} - Use it to display a series point’s values as percent.
- {S} - Use it to display the series name.
Note
A complete sample project is available at https://github.com/DevExpress-Examples/how-to-create-a-2d-funnel-chart-t102358.
<Window
        xmlns="http://schemas.microsoft.com/winfx/2006/xaml/presentation"
        xmlns:x="http://schemas.microsoft.com/winfx/2006/xaml"
        xmlns:dxc="http://schemas.devexpress.com/winfx/2008/xaml/charts"
        x:Class="FunnelChart.MainWindow"
        Title="MainWindow" Height="650" Width="900">
    <Grid>
        <dxc:ChartControl>
            <dxc:ChartControl.Diagram>
                <dxc:SimpleDiagram2D>
                    <dxc:FunnelSeries2D LegendTextPattern="{}{A}: {VP: ##.##%}"
                                    HeightToWidthRatioAuto="False" HeightToWidthRatio="0.9"
                                    PointDistance="2">
                        <dxc:SeriesPoint Argument="Visited a Web Site" Value="9152" />
                        <dxc:SeriesPoint Argument="Downloaded a Trial" Value="6870" />
                        <dxc:SeriesPoint Argument="Contacted to Support" Value="5121" />
                        <dxc:SeriesPoint Argument="Subscribed" Value="2224" />
                        <dxc:SeriesPoint Argument="Renewed" Value="1670" />
                        <dxc:FunnelSeries2D.Label>
                            <dxc:SeriesLabel Visible="True" TextPattern="{}{A}: {VP: ##.##%}"
                                        dxc:FunnelSeries2D.LabelPosition="Center"/>
                        </dxc:FunnelSeries2D.Label>
                        <dxc:FunnelSeries2D.Titles>
                            <dxc:Title Dock="Top" HorizontalAlignment="Center"
                                   FontSize="24">Web Site Visitor Trend</dxc:Title>
                        </dxc:FunnelSeries2D.Titles>
                    </dxc:FunnelSeries2D>
                </dxc:SimpleDiagram2D>
            </dxc:ChartControl.Diagram>
            <dxc:ChartControl.Legend>
                <dxc:Legend/>
            </dxc:ChartControl.Legend>
        </dxc:ChartControl>
    </Grid>
</Window>
Related GitHub Examples
The following code snippet (auto-collected from DevExpress Examples) contains a reference to the HeightToWidthRatioAuto property.
Note
The algorithm used to collect these code examples remains a work in progress. Accordingly, the links and snippets below may produce inaccurate results. If you encounter an issue with code examples below, please use the feedback form on this page to report the issue.