RangeColorizer3D Class
Colorizer that colors all points by values.
Namespace: DevExpress.Xpf.Charts
Assembly: DevExpress.Xpf.Charts.v18.2.dll
Declaration
Remarks
The following image demonstrates 3D bars colored using this colorizer.
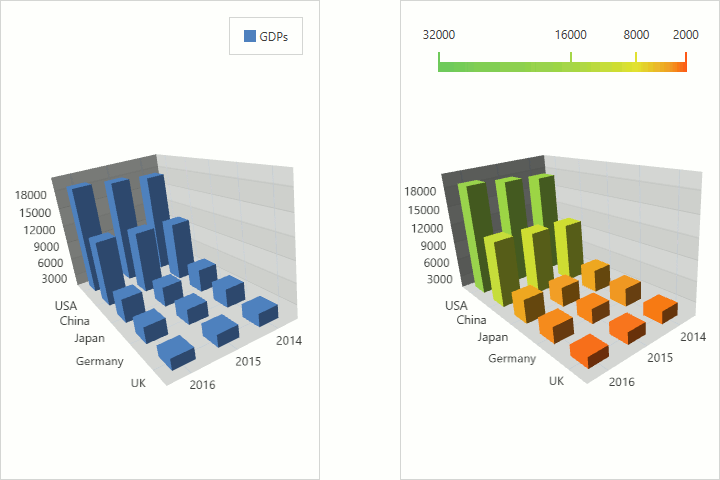
Example
This example demonstrates how to colorize series point markers based on range values. To do this, assign a RangeColorizer3D object to the Series3DViewBase.Colorizer property. Then, configure range stops using the RangeColorizer3D.RangeStops property and optionally, configure required colors using the PaletteColorizer3DBase.Palette property. Finally, specify which values should be measured - you can do this using the RangeColorizer3D.ValueProvider property.
Note
A complete sample project is available at https://github.com/DevExpress-Examples/how-to-colorize-series-point-markers-based-on-range-values-t466516.
<Window xmlns="http://schemas.microsoft.com/winfx/2006/xaml/presentation"
        xmlns:x="http://schemas.microsoft.com/winfx/2006/xaml"
        xmlns:d="http://schemas.microsoft.com/expression/blend/2008"
        xmlns:mc="http://schemas.openxmlformats.org/markup-compatibility/2006"
        xmlns:view="clr-namespace:RangeColorizer3DExample"
        xmlns:viewModel="clr-namespace:RangeColorizer3DExample.ViewModel"
        xmlns:dxc="http://schemas.devexpress.com/winfx/2008/xaml/charts"
        x:Class="RangeColorizer3DExample.MainWindow"
        mc:Ignorable="d"
        Title="MainWindow"
        Height="309"
        Width="496">
    <Window.DataContext>
        <viewModel:GdpViewModel />
    </Window.DataContext>
    <Grid>

        <dxc:Chart3DControl AspectRatio="5,3,3"
                            Padding="0">
            <dxc:Chart3DControl.Legends>
                <dxc:Legend HorizontalPosition="Right"
                            VerticalPosition="Top"
                            Orientation="Horizontal"/>
            </dxc:Chart3DControl.Legends>
            <dxc:Series3DStorage>
                <!--region #Series-->
                <dxc:Series3D DisplayName="Gdps"
                              YArgumentScaleType="Qualitative">
                    <dxc:Series3D.View>
                        <dxc:Bar3DSeriesView>
                            <dxc:Bar3DSeriesView.Colorizer>
                                <dxc:RangeColorizer3D ApproximateColors="True"
                                                      RangeStops="2000 4000 8000 16000 32000">
                                    <dxc:RangeColorizer3D.Palette>
                                        <dxc:CustomPalette>
                                            <dxc:CustomPalette.Colors>
                                                <Color>#FD5915</Color>
                                                <Color>#F09D25</Color>
                                                <Color>#E2E232</Color>
                                                <Color>#A5D648</Color>
                                                <Color>#6EC95C</Color>
                                            </dxc:CustomPalette.Colors>
                                        </dxc:CustomPalette>
                                    </dxc:RangeColorizer3D.Palette>
                                </dxc:RangeColorizer3D>
                            </dxc:Bar3DSeriesView.Colorizer>
                            <dxc:Bar3DSeriesView.BarModel>
                                <dxc:Bar3DBoxPointModel ShowFacets="False" />
                            </dxc:Bar3DSeriesView.BarModel>
                        </dxc:Bar3DSeriesView>
                    </dxc:Series3D.View>
                    <dxc:SeriesPoint3DDataSourceAdapter DataSource="{Binding Path=Gdps}"
                                                        XArgumentDataMember="Country"
                                                        YArgumentDataMember="Year"
                                                        ValueDataMember="Value"
                                                        ColorDataMember="Region" />
                </dxc:Series3D>
                <!--endregion #Series-->
            </dxc:Series3DStorage>
        </dxc:Chart3DControl>

    </Grid>
</Window>
Related GitHub Examples
The following code snippets (auto-collected from DevExpress Examples) contain references to the RangeColorizer3D class.
Note
The algorithm used to collect these code examples remains a work in progress. Accordingly, the links and snippets below may produce inaccurate results. If you encounter an issue with code examples below, please use the feedback form on this page to report the issue.