ChartOptions.DisplayBlanksAs Property
Gets or sets a value that specifies how empty cells should be plotted on a chart.
Namespace: DevExpress.Spreadsheet.Charts
Assembly: DevExpress.Spreadsheet.v18.2.Core.dll
Declaration
Property Value
| Type | Description |
|---|---|
| DisplayBlanksAs | A DisplayBlanksAs enumeration value that determines how blank values should be displayed on a chart. |
Available values:
| Name | Description |
|---|---|
| Zero | Specifies that empty cells should be treated as zeros. |
| Span | Specifies that empty cells should be spanned with a line. |
| Gap | Specifies that empty cells should be displayed as gaps on a chart. |
Property Paths
You can access this nested property as listed below:
| Object Type | Path to DisplayBlanksAs |
|---|---|
| ChartObject |
|
Remarks
Use the DisplayBlanksAs property to determine the way how empty cells are plotted on a line, area, scatter or radar chart.
The image below shows the possible ways to display blank values on a chart.
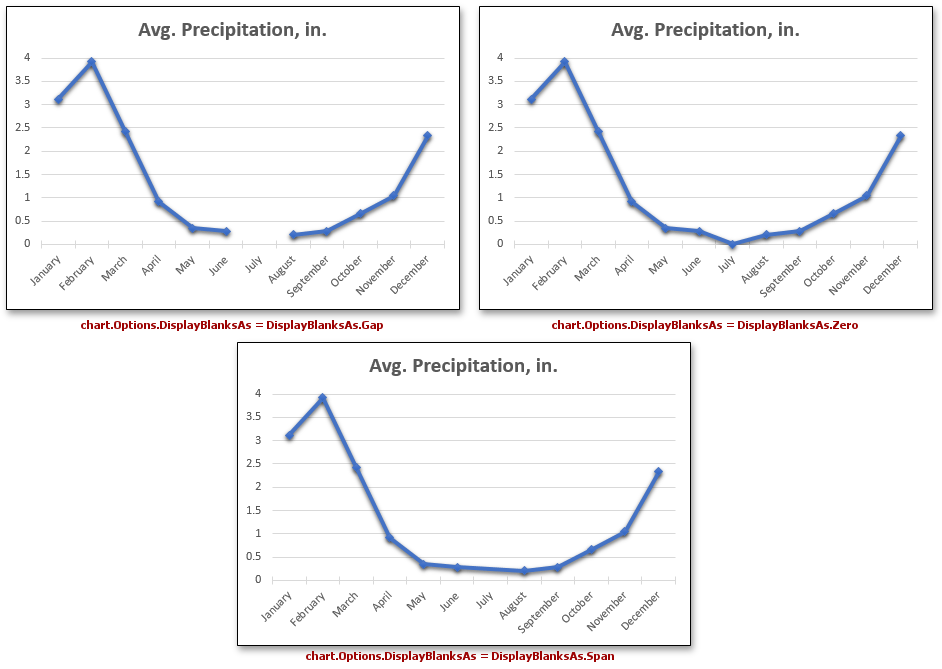
Note
The Spreadsheet control supports only the DisplayBlanksAs.Gap and DisplayBlanksAs.Zero modes. If the DisplayBlanksAs.Span mode is specified, the Spreadsheet treats it as DisplayBlanksAs.Gap. However, this setting is saved to a document, so you can view the resulting chart in Microsoft® Excel® or another spreadsheet application.
To specify whether or not to show data in hidden rows and columns on a chart, use the ChartOptions.PlotVisibleOnly property.