How to: Specify Sparkline Axis Settings
- 4 minutes to read
After you add sparkline charts to a worksheet, you can configure their horizontal and vertical axis settings to represent your data in the most efficient manner.
Horizontal Axis Options
To adjust the horizontal axis settings for a sparkline group, use the SparklineGroup.HorizontalAxis property. This property provides access to the SparklineHorizontalAxis object, which allows you to specify the following axis options.
Visibility
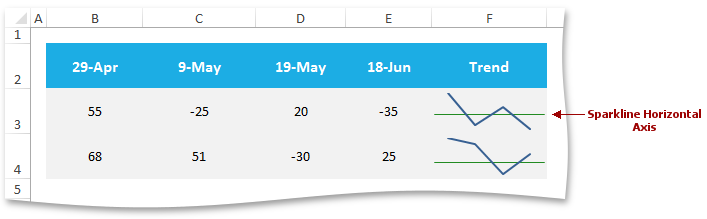
To display the horizontal axis on a sparkline, set the SparklineColor.IsVisible property of the SparklineHorizontalAxis object to true. Note that the horizontal axis for a sparkline is displayed only when the sparkline data contains both positive and negative values; otherwise, the axis is not shown.
To change the axis color, set the SparklineColor.Color property for the SparklineHorizontalAxis object.
// Create a group of line sparklines.
SparklineGroup lineGroup = worksheet.SparklineGroups.Add(worksheet["F3:F4"], worksheet["B3:E3,B4:E4"], SparklineGroupType.Line);

// Display the horizontal axis and specify its color.
lineGroup.HorizontalAxis.IsVisible = true;
lineGroup.HorizontalAxis.Color = Color.ForestGreen;
Axis Type
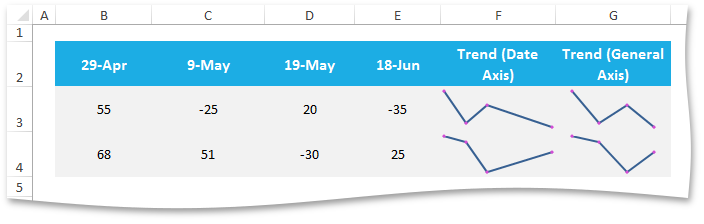
By default, when you create a sparkline, it uses the general axis type that displays data points on a sparkline at regular intervals. However, if the underlying data occurs in irregular periods of time, you can reflect these time intervals on a sparkline by spacing data markers out in proportion to the date (the longer the interval between dates, the longer the space between the corresponding data markers on a sparkline). To change the axis type to date axis, assign the cell range containing date values for the required sparkline group to the SparklineGroup.DateRange property. This will automatically convert the horizontal axis to the date axis (the SparklineHorizontalAxis.IsDateAxis property will return true).
// Specify the date range for the sparkline group.
lineGroup.DateRange = worksheet["B2:E2"];
Data Plotting Order
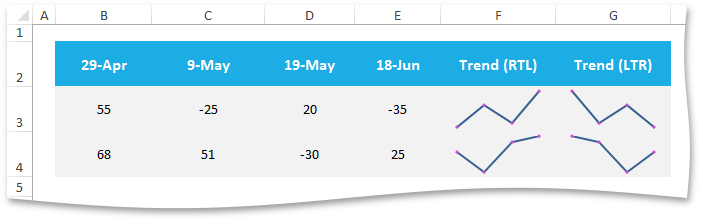
If you wish to display data points on each sparkline in the sparkline group in the reverse direction (in right-to-left order), set the SparklineHorizontalAxis.RightToLeft property to true.
Vertical Axis Options
To specify scaling options for the vertical axis of a sparkline group, use the SparklineGroup.VerticalAxis property. This property allows you to specify how to calculate the minimum and maximum values for the vertical axis.
You can select one of the following options.
- Automatic for each sparkline
- Minimum and maximum values are calculated individually for each sparkline in the group based on the lowest and highest values in the sparkline data range. To use this option, set the SparklineVerticalAxis.MinScaleType and SparklineVerticalAxis.MaxScaleType properties to the SparklineAxisScaling.Individual value.
- Same for all sparklines.
- All sparklines in the group use the same scale that is calculated automatically based on the lowest and highest values in the group data range. To use this option, set the SparklineVerticalAxis.MinScaleType and SparklineVerticalAxis.MaxScaleType properties to the SparklineAxisScaling.Group value.
- Custom value.
- Specifies custom values for the minimum and maximum of the vertical axis. To use custom scaling, set the SparklineVerticalAxis.MinScaleType and SparklineVerticalAxis.MaxScaleType properties to the SparklineAxisScaling.Custom value, and then assign the required numbers to the SparklineVerticalAxis.MinCustomValue and SparklineVerticalAxis.MaxCustomValue properties.
The example below demonstrates how to specify custom scaling values for the vertical axis of a sparkline group.
Worksheet worksheet = workbook.Worksheets["SparklineExamples"];
workbook.Worksheets.ActiveWorksheet = worksheet;

// Create a group of column sparklines.
SparklineGroup columnGroup = worksheet.SparklineGroups.Add(worksheet["G4:G7"], worksheet["C4:F4,C5:F5,C6:F6, C7:F7"], SparklineGroupType.Column);

// Specify the vertical axis options.
SparklineVerticalAxis verticalAxis = columnGroup.VerticalAxis;
// Set the custom minimum value for the vertical axis.
verticalAxis.MinScaleType = SparklineAxisScaling.Custom;
verticalAxis.MinCustomValue = 0;
// Set the custom maximum value for the vertical axis.
verticalAxis.MaxScaleType = SparklineAxisScaling.Custom;
verticalAxis.MaxCustomValue = 12000;