How to: Customize the Sparkline Appearance
- 3 minutes to read
The following example customizes the sparkline appearance.
Specify a Sparkline Color
To specify a color used to draw each sparkline in the sparkline group, use the SparklineGroup.SeriesColor property. For a group of line sparklines, you can also set the line weight by utilizing the SparklineGroup.LineWeight property.
Highlight Data Points
You can highlight important data points on a sparkline by displaying and coloring markers on line sparklines, or by differentiating points by color on column and win/loss sparklines. To get access to the marker options, use the SparklineGroup.Points property, which returns the SparklinePoints object. The table below lists the object’s properties used to show specific points on each sparkline in the sparkline group. All these properties return the SparklineColor object which controls the visibility and color of data markers.
To display the desired marker on a line sparkline, use the corresponding property to get access to the SparklineColor object, and set the SparklineColor.IsVisible property to true. In case of column and win/loss sparklines (which display all data markers by default), setting the SparklineColor.IsVisible property highlights the proper sparkline bars using the color defined by the applied sparkline style. To apply a custom color to the marker, assign the desired color to the SparklineColor.Color property.
| Property | Description |
|---|---|
| SparklinePoints.Markers | Displays all markers on a line sparkline to differentiate individual data points. |
| SparklinePoints.Negative | Highlights markers that correspond to all data values less than zero. |
| SparklinePoints.Highest | Highlights a marker that corresponds to the highest data value. |
| SparklinePoints.Lowest | Highlights a marker that corresponds to the lowest data value. |
| SparklinePoints.First | Highlights a marker that corresponds to the first data point. |
| SparklinePoints.Last | Highlights a marker that corresponds to the last data point. |
Example
Worksheet worksheet = workbook.Worksheets["SparklineExamples"];
workbook.Worksheets.ActiveWorksheet = worksheet;

// Create a group of line sparklines.
SparklineGroup lineGroup = worksheet.SparklineGroups.Add(worksheet["G4:G7"], worksheet["C4:F4,C5:F5,C6:F6, C7:F7"], SparklineGroupType.Line);

// Customize the group appearance.
// Set the sparkline color.
lineGroup.SeriesColor = Color.FromArgb(0x1F, 0x49, 0x7D);

// Set the sparkline weight.
lineGroup.LineWeight = 1.5;

// Display data markers on the sparklines and specify their color.
SparklinePoints points = lineGroup.Points;
points.Markers.IsVisible = true;
points.Markers.Color = Color.FromArgb(0x4B, 0xAC, 0xC6);

// Highlight the highest and lowest points on each sparkline in the group.
points.Highest.Color = Color.FromArgb(0xA9, 0xD6, 0x4F);
points.Lowest.Color = Color.FromArgb(0x80, 0x64, 0xA2);
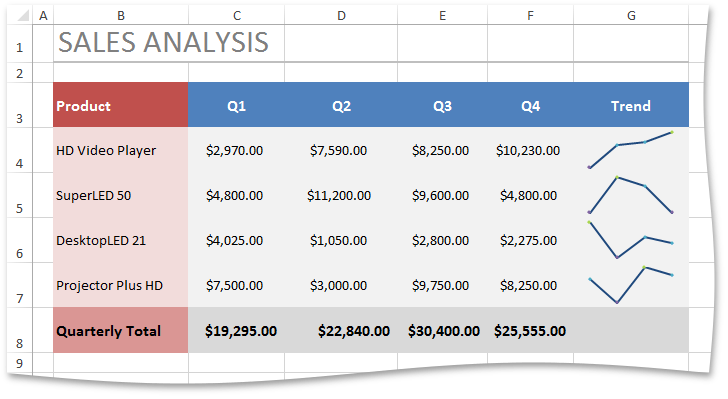
The following image shows sparkline charts created by the code above (the workbook is opened in Microsoft® Excel®).