How to: Insert Subtotals in a Data Range
- 2 minutes to read
The example below demonstrates how to use the Worksheet.Subtotal method to automatically create outlines for a sorted range and summarize data in each group using the SUBTOTAL function.
Important
Before subtotaling, make sure that the range you wish to subtotal has column headings in the first row and the data in this range is sorted by a column at each change in which a subtotal row will be inserted.
To insert subtotals, do the following.
- Specify the CellRange object, which contains data you wish to subtotal
- Create a list of column indexes that define columns for which the subtotals should be calculated. In this example, the SUBTOTAL function will be calculated only for column “D” (with Column.Index equal to 3).
Call the Worksheet.Subtotal method and pass the following parameters: the specified data range to be subtotaled, the index of the column by which you wish to group your data, the specified list of columns to which the subtotals should be added, the code of the function to be used in calculating subtotals and the text to be displayed in the summary rows.
In this example, a subtotal row will be inserted each time a value in column “B” (with Column.Index equal to 1) changes. The SUM function with code 9 is used to calculate subtotals.
CellRange dataRange = worksheet["B3:E23"];
// Specify that subtotals should be calculated for the column "D".
List<int> subtotalColumnsList = new List<int>();
subtotalColumnsList.Add(3);
// Insert subtotals by each change in the column "B" and calculate the SUM fuction for the related rows in the column "D".
worksheet.Subtotal(dataRange, 1, subtotalColumnsList, 9, "Total");
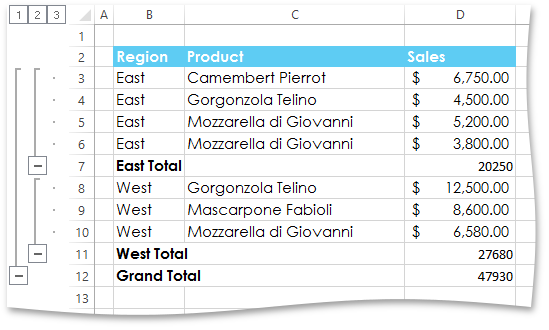
The image below shows the result (the workbook is opened in Microsoft® Excel®).