Customizing a Color Scheme
- 4 minutes to read
The Dashboard Designer allows you to edit colors contained in global and local color schemes. You can select the required color from the default dashboard palette or specify a custom color.
- Invoke a Color Scheme Dialog
- Edit Colors
- Add a New Value
- Add a New Color Table
- Customize a Color Scheme in Code
Invoke a Color Scheme Dialog
To edit colors, use the Color Scheme dialog. You can invoke this dialog in the following ways.
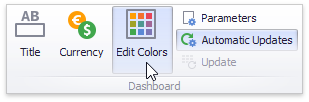
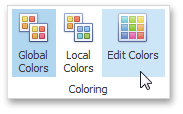
To edit colors in a global color scheme, use the Edit Colors button in the Home ribbon tab or the Edit Colors button in the dashboard item’s Design tab.
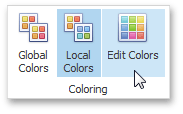
To edit colors in a local color scheme, use the Edit Colors button in the contextual Design ribbon tab.
Consider a Chart dashboard item whose dimensions and measures are colored by hue with local colors.
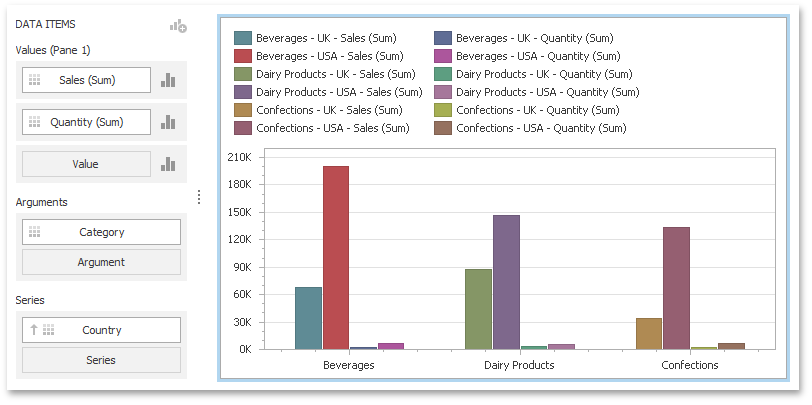
For this dashboard item, the Color Scheme dialog will contain combinations of all dimension values and a specific measure.
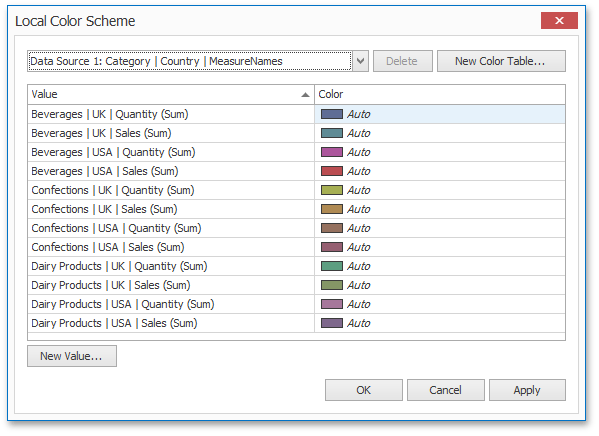
In this dialog, you can perform the following actions.
- Edit automatically assigned colors or specify new colors.
- Add new values to a color table.
- Add new color tables that contain values whose colors are not yet assigned.
Edit Colors
You can customize automatically assigned colors in several ways.
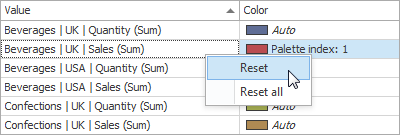
To retain the automatically assigned color for the selected value, right-click the required value in the Value column and select Retain this color.
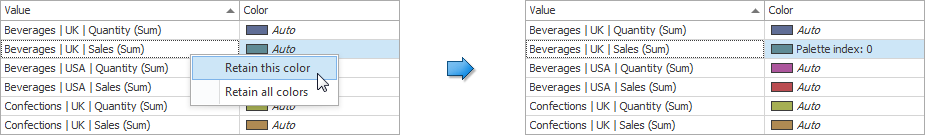
This reserves the current palette color for the selected value.
You can click the required cell in the Color column to select another palette color.
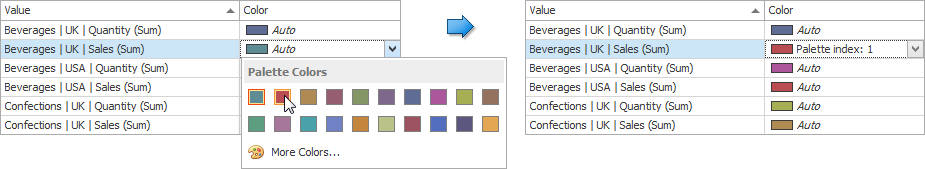
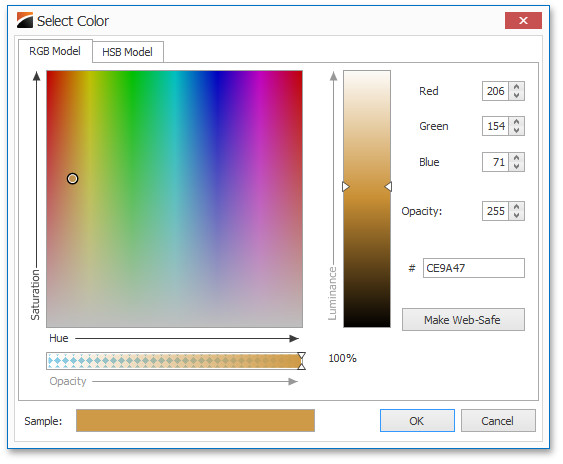
To specify a custom color, click More Colors… and use the RGB or HSB color model in the invoked Select Color dialog to choose any color.
Use the Reset/Reset all menu items to reset the customized color(s).
Add a New Value
The Color Scheme dialog allows you to add a new value with the specified color to the selected color table. To do this, click the New Value… button.
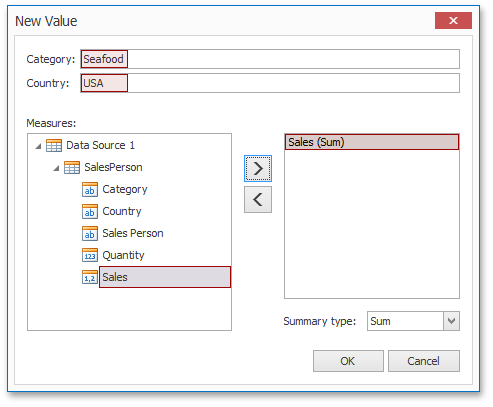
In the invoked New Value dialog, specify the dimension values, add the required measures and click OK. This creates a new value whose color can be specified as described in Edit Colors.
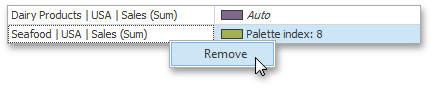
You can use the Remove context menu item to remove manually added values.
Add a New Color Table
The Color Scheme dialog also allows you to add a new color table that contains values whose colors are not yet assigned. To do this, click the New Color Table… button.
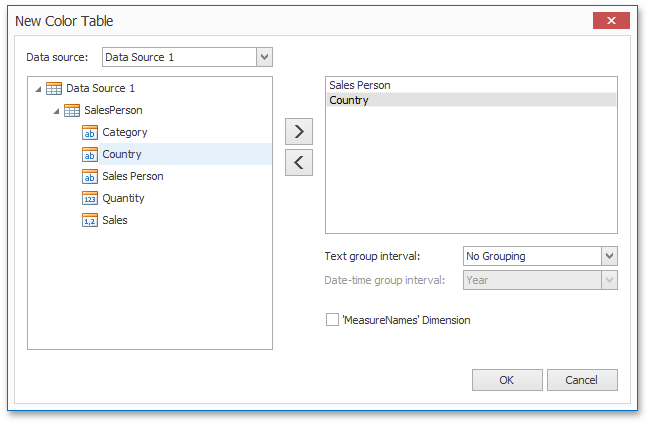
In the invoked dialog, specify the data source, add the required dimensions and enable the ‘MeasureNames’ Dimension check-box if you need to add measures to a color table.
Click OK to add the color table to a color scheme. Then, you can add values to this table (see Add a New Value) and specify its colors (see Edit Colors).
Customize a Color Scheme in Code
You can color dashboard item elements in the following two ways.
- Use a global color scheme to paint identical values across the dashboard with consistent colors. To access the dashboard color scheme, use the Dashboard.ColorScheme property.
- Use a local color scheme to paint each dashboard item with an individual set of colors. For instance, you can use the ChartDashboardItemBase.ColorScheme property to access a local color scheme for the Chart and Pie dashboard items.
Use the ColorScheme class to access a collection of ColorSchemeEntry objects that allow you to map the required dimension values/measures and the specified color. To do this, use the following members.
- The ColorSchemeEntry.DimensionKeys collection contains ColorSchemeDimensionKey objects that allow you to specify the dimension and corresponding dimension value. Use the Dimension.GetDimensionDefinition method to obtain the dimension definition and pass the returned object to the ColorSchemeDimensionKey constructor.
- The ColorSchemeEntry.MeasureKey property returns the ColorSchemeMeasureKey object. This object allows you to specify measures to be colored. Use the Measure.GetMeasureDefinition method to obtain the measure definition and pass the returned object to the ColorSchemeMeasureKey constructor.
- The ColorSchemeEntry.DataSource property specifies the data source that contains the required dimensions and measures.
- The ColorSchemeEntry.ColorDefinition property allows you to specify the color used to color the dimension values/measures specified above. You can select the required color from the default palette or specify a custom color.