Bind Dashboard Items to Data in OLAP Mode
- 3 minutes to read
In OLAP mode, the cube schema is fetched automatically, and the Data Source Browser displays the entire OLAP cube structure.
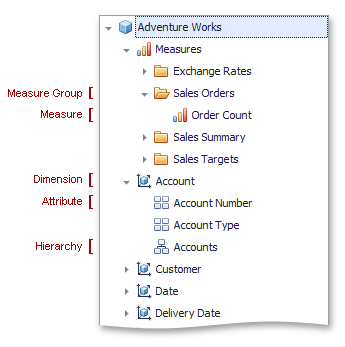
To visualize data, drag and drop measures, attributes or hierarchies to appropriate data sections in the DATA ITEMS pane as described in the Bind Dashboard Items to Data in the Designer topic.
Note that OLAP measures can be placed only in the Values section, while dimension attributes and hierarchies can be placed within other data sections.
Note
The dashboard displays only dimension values that have intersections with measures in a cube. To show all available dimension values, add hidden measures to a dashboard item so that all dimension values have at least one measure value.
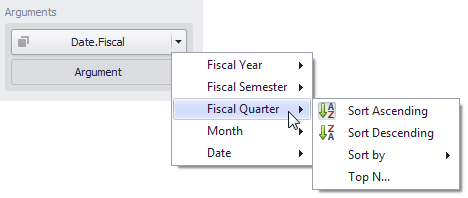
OLAP hierarchies allow you to customize each level separately. To access hierarchy level options, invoke the data item menu for a hierarchy and then use the submenu that corresponds to the desired level.
For more information refer to the OLAP Mode Limitations topic.
Example
The following code snippets show how to bind the dashboard to the OLAP cube using DashboardOlapDataSource.
DashboardOlapDataSource allows you to establish a connection to the OLAP cube by specifying a connection string.
using DevExpress.XtraBars.Ribbon;
using DevExpress.DashboardCommon;
using DevExpress.DataAccess.ConnectionParameters;

namespace Dashboard_OlapDataProvider {
    public partial class Form1 : RibbonForm {
        public Form1() {
            InitializeComponent();

            #region #OLAPDataSource
            OlapConnectionParameters olapParams = new OlapConnectionParameters();
            olapParams.ConnectionString = @"provider=MSOLAP;
                                  data source=http://demos.devexpress.com/Services/OLAP/msmdpump.dll;
                                  initial catalog=Adventure Works DW Standard Edition;
                                  cube name=Adventure Works;";

            DashboardOlapDataSource olapDataSource = new DashboardOlapDataSource(olapParams);
            olapDataSource.Fill();

            dashboardDesigner1.Dashboard.DataSources.Add(olapDataSource);
            #endregion #OLAPDataSource

            InitializeDashboardItems();
        }

        void InitializeDashboardItems() {
            IDashboardDataSource olapDataSource = dashboardDesigner1.Dashboard.DataSources[0];

            PivotDashboardItem pivot = new PivotDashboardItem();
            pivot.DataSource = olapDataSource;
            pivot.Values.Add(new Measure("[Measures].[Sales Amount]"));
            pivot.Columns.Add(new Dimension("[Sales Channel].[Sales Channel].[Sales Channel]"));
            pivot.Rows.AddRange(
                new Dimension("[Sales Territory].[Sales Territory].[Group]", 1),
                new Dimension("[Sales Territory].[Sales Territory].[Country]", 1),
                new Dimension("[Sales Territory].[Sales Territory].[Region]", 1));
            pivot.AutoExpandRowGroups = true;

            ChartDashboardItem chart = new ChartDashboardItem();
            chart.DataSource = olapDataSource;
            chart.Arguments.Add(new Dimension("[Sales Territory].[Sales Territory].[Country]"));
            chart.Panes.Add(new ChartPane());
            SimpleSeries salesAmountSeries = new SimpleSeries(SimpleSeriesType.Bar);
            salesAmountSeries.Value = new Measure("[Measures].[Sales Amount]");
            chart.Panes[0].Series.Add(salesAmountSeries);

            dashboardDesigner1.Dashboard.Items.AddRange(pivot, chart);
        }
    }
}