Create Dashboards in the Web Dashboard Control
- 3 minutes to read
This lesson shows how to create a dashboard in the Web Dashboard Designer application prepared in one of the Get Started tutorials.
Step 1. Create a Dashboard
At the startup, your web application does not display any dashboard:
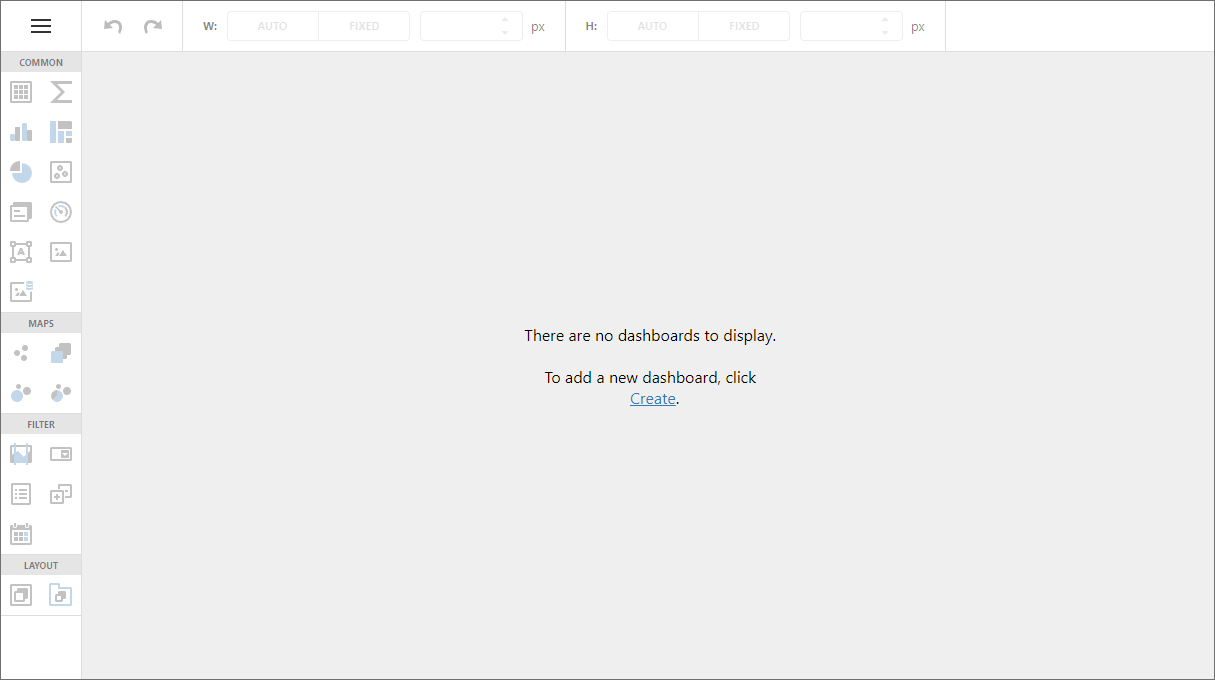
Click Create in the designer’s surface.
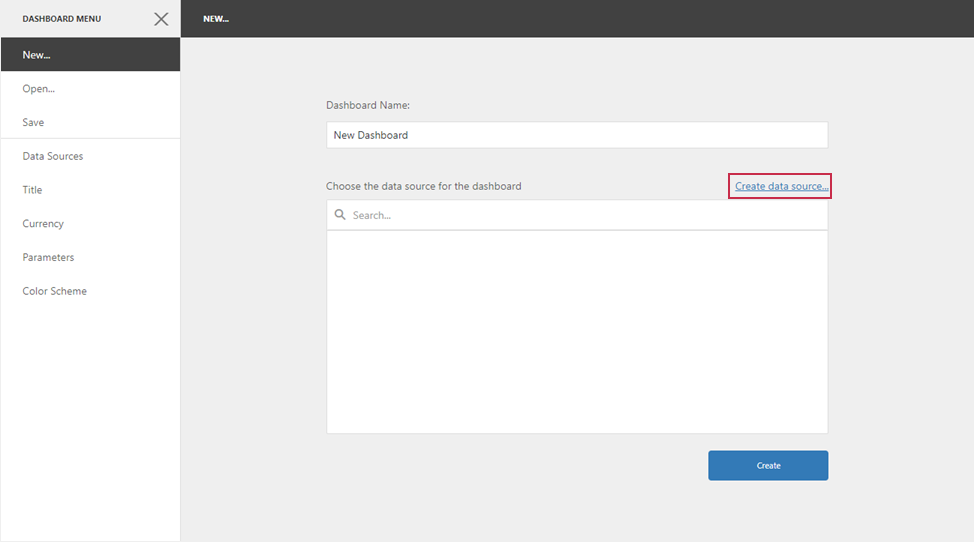
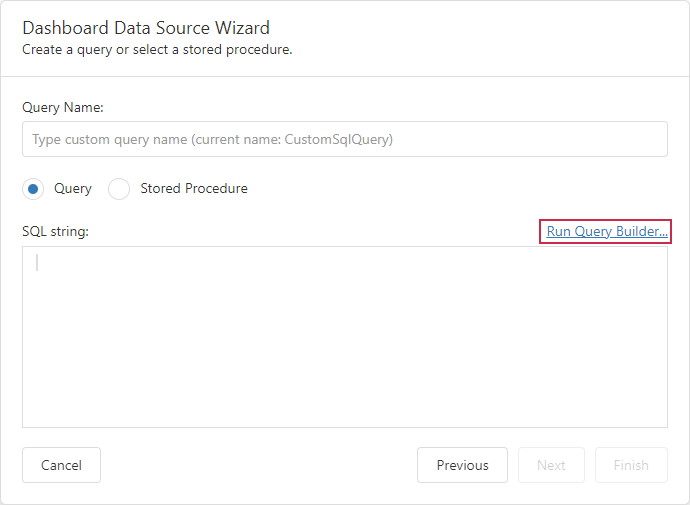
In the invoked New page, click the Create Data Source… button:
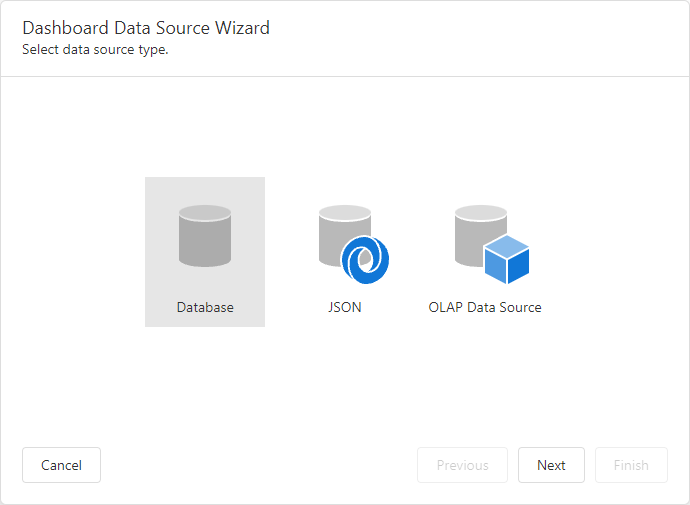
Select Database in the invoked Dashboard Data Source Wizard.
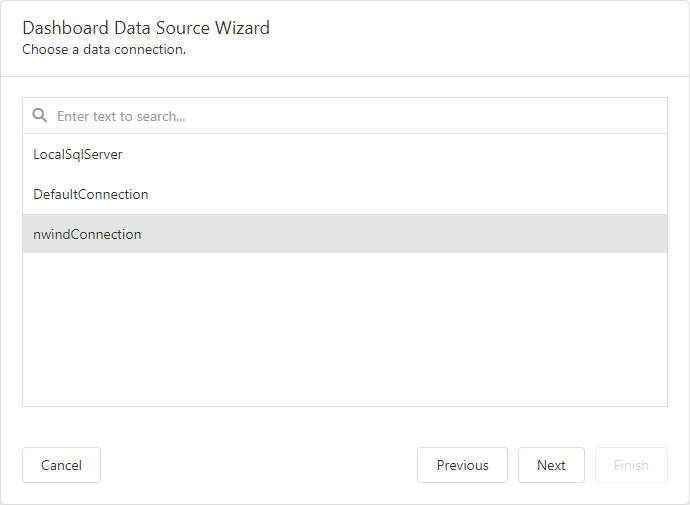
On the next page, select the data connection (for example, nwindConnection).
Click Run Query Builder… on the next page.
In the invoked Query Builder, drag the SalesPerson view from Available Tables and Views on the right and drop it onto the empty surface. Enable the check box in the header.
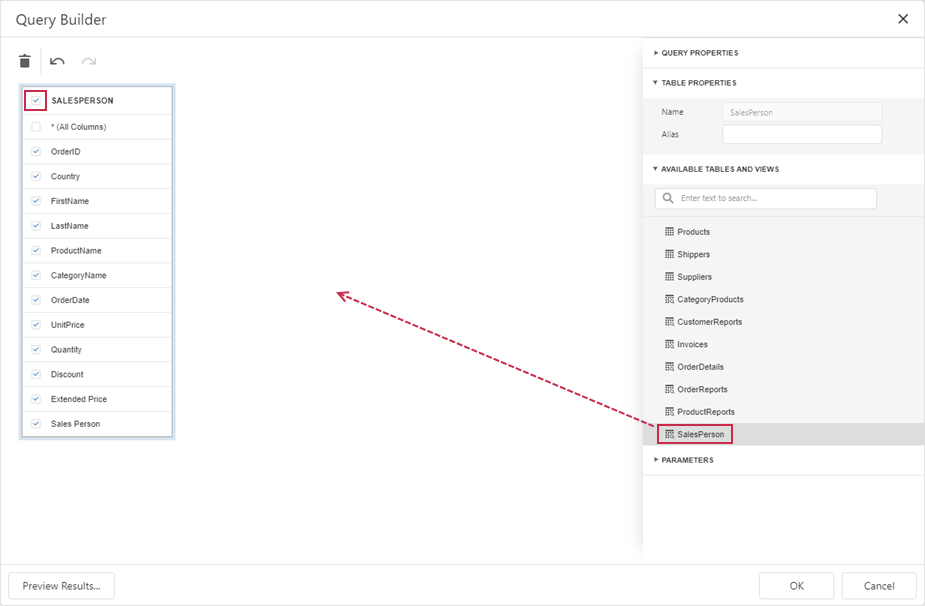
Click OK to save a query. The Data Source wizard now displays the generated query.
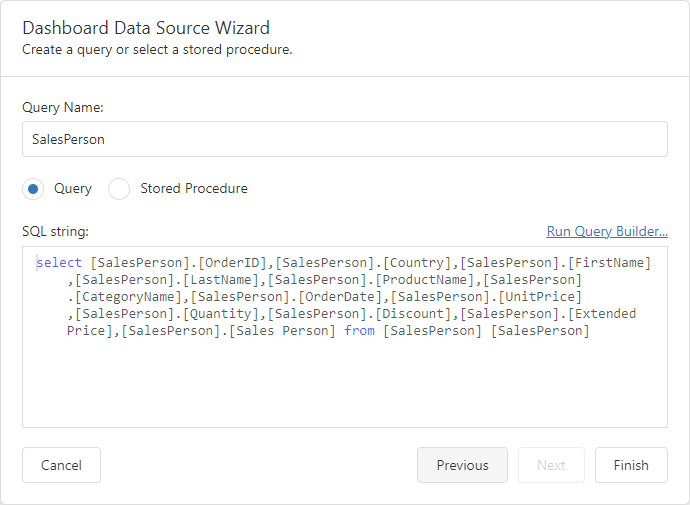
Click Finish to close the Query Builder.
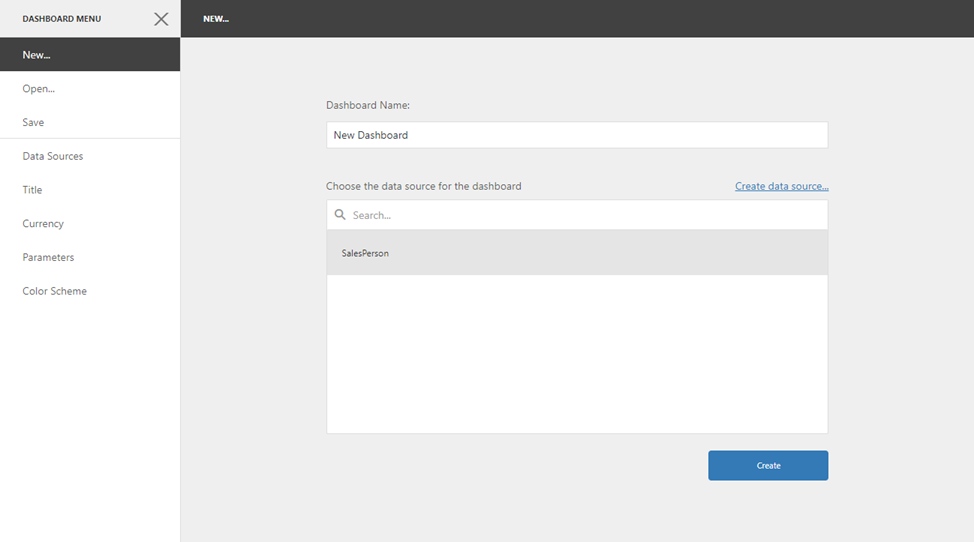
Click Create to create a dashboard with the newly created data source.
Step 2. Create Dashboard Items
To add a dashboard item to a dashboard, click the corresponding button in the Toolbox.
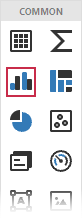
Add a Chart Item
Click the Chart button to add a chart.
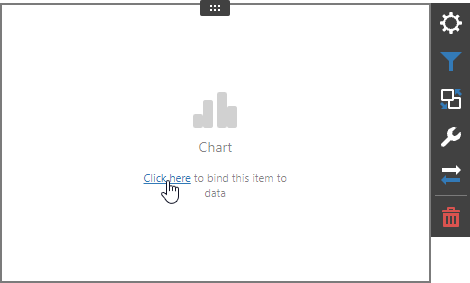
Select the created Chart and click the link on its surface to bind it to data.
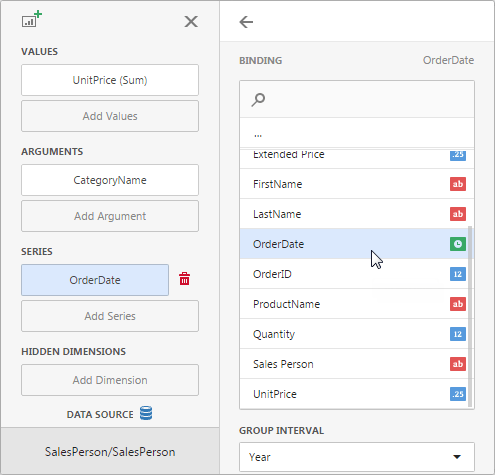
In the opened Binding menu, select the Add Values placeholder. Click the UnitPrice field to add it to the Values section. In the same way, add the CategoryName field to the Arguments section and the OrderDate field to the Series section.
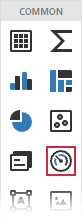
Add a Gauge Item
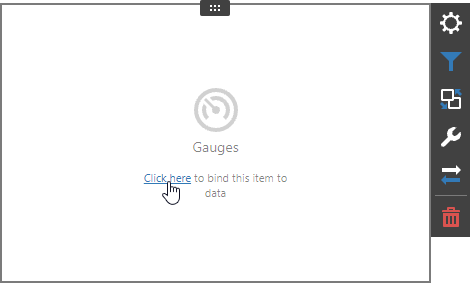
Click the Gauges button in the Toolbox to add gauges.
Select the created Gauge and click the link on its surface to bind it to data.
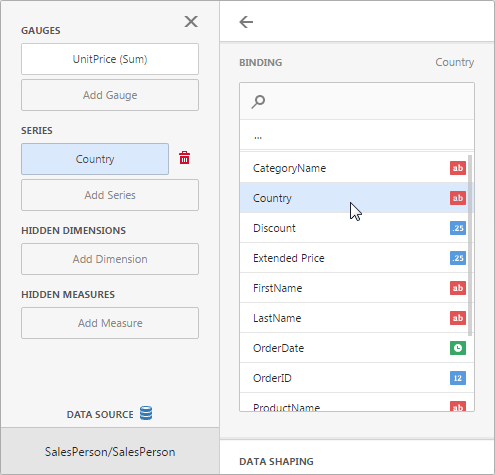
In the opened Binding menu, select the Add Gauge placeholder. Click the UnitPrice field to add it to the Gauges section. In the same way, add the Country field to the Series section.
Add a Card Item
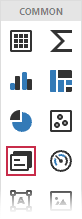
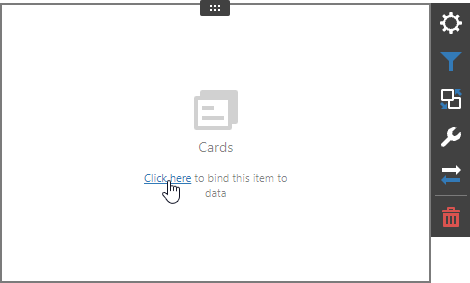
Click the Card button in the Toolbox to add cards.
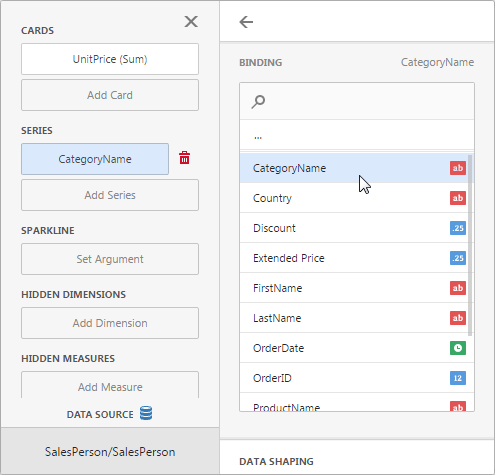
Select the created Card and click the link on its surface to bind it to data.
In the opened Binding menu, select the Add Card placeholder. Click the UnitPrice field to add it to the Cards section. In the same way, add the CategoryName field to the Series section.
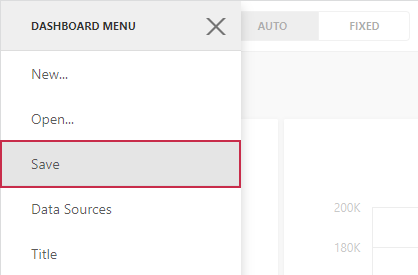
Step 3. Save the Dashboard
Open the dashboard menu and click Save. The dashboard XML file is saved to the previously created storage (App_Data).
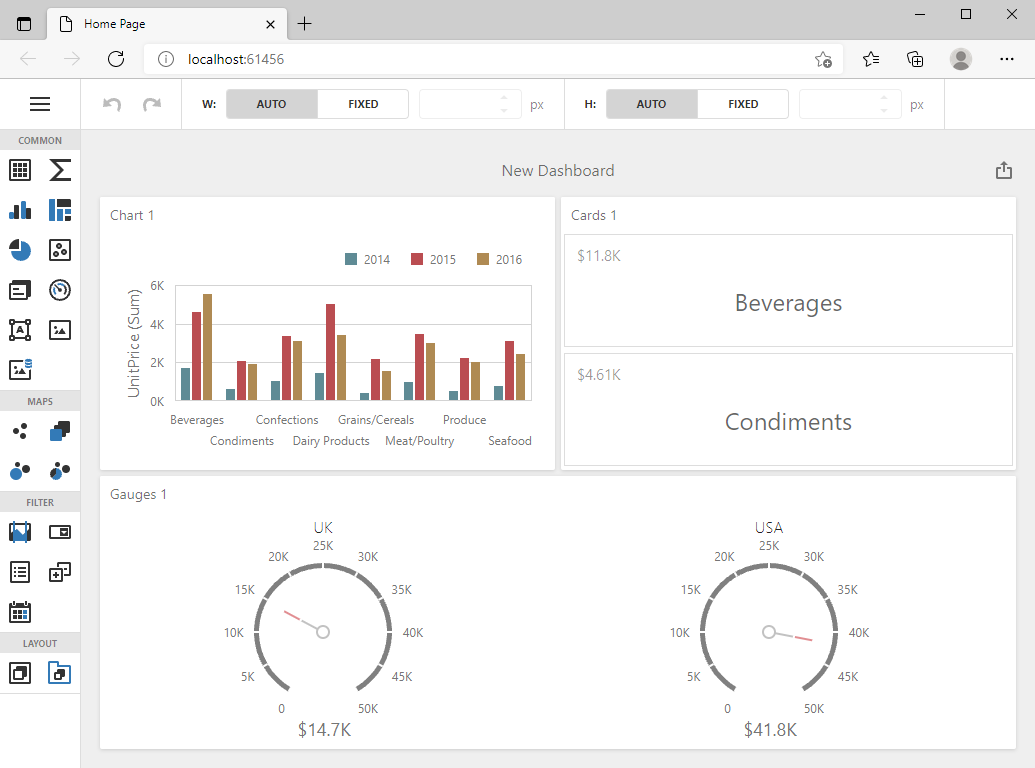
Resulted Dashboard
The dashboard is now ready. The ready-to-use dashboard should look like this:
Next Steps
You can add new dashboard items, rearrange and resize them, set fixed dimensions (height and width) for a dashboard, configure interactivity between items, and so much more. Refer to the following section to find more information about creating dashboards: Create Dashboards on the Web.
After you finish to design a dashboard, you can switch your application to Viewer mode.