Top-Bottom
- 2 minutes to read
The Top-Bottom format conditions allow you to highlight a specific number of topmost/bottommost values. You can specify this number as an absolute or percent value.
The following condition types are supported for measures.
Format Condition | Description | Can be applied to |
|---|---|---|
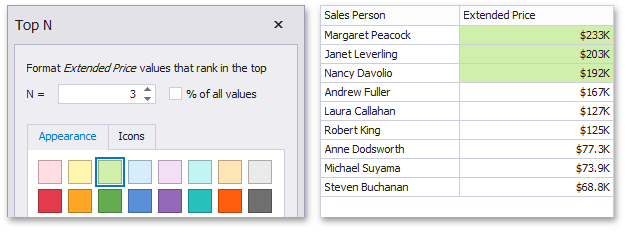
The Top N format condition allows you to apply formatting to elements whose values are ranked at the top. For instance, the following image displays a Grid dashboard item whose top 3 Extended Price values filled in green.
| Measures | |
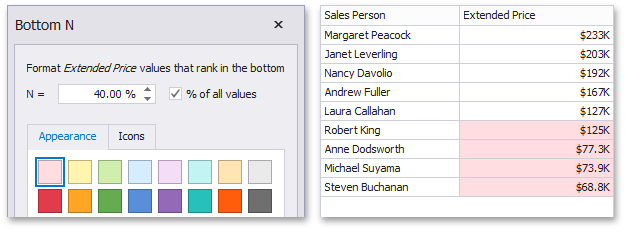
The Bottom N format condition allows you to apply formatting to elements whose values are ranked at the bottom. For instance, the following image displays a Grid dashboard item whose bottom 40 percent Extended Price values are filled in red.
| Measures |
To create the Top-Bottom format condition in code, create the FormatConditionTopBottom class instance and specify the following settings.
- Specify whether the formatting is applied to top or bottom values using the FormatConditionTopBottom.TopBottom property.
- Specify whether an absolute or percent boundary value is used to apply formatting using the FormatConditionTopBottom.RankType property.
- Specify the required rank value using the FormatConditionTopBottom.Rank property.
- Specify the required style settings applied to target elements using the FormatConditionStyleBase.StyleSettings property. You can change the color of dashboard item elements, font settings (AppearanceSettings) or add predefined icons (IconSettings).
Assign the resulting FormatConditionTopBottom object to the DashboardItemFormatRule.Condition property.
How to: Apply Conditional Formatting to Grid Cells using the Top-Bottom and Average Conditions