TimeSpanScaleOptions.GridAlignment Property
Gets or sets the time-span measure unit to which the beginning of an axis’ gridlines and labels should be aligned.
Namespace: DevExpress.XtraCharts
Assembly: DevExpress.XtraCharts.v20.2.dll
NuGet Packages: DevExpress.Charts, DevExpress.WindowsDesktop.Charts
Declaration
Property Value
| Type | Description |
|---|---|
| TimeSpanGridAlignment | A value that represents the measurement unit to which the beginning of an axis’s gridlines and labels should be aligned. |
Available values:
| Name | Description |
|---|---|
| Millisecond | Specifies millisecond as the time-span unit to which axis grid lines should be aligned. |
| Second | Specifies second as the time-span unit to which axis grid lines should be aligned. |
| Minute | Specifies minute as the time-span unit to which axis grid lines should be aligned. |
| Hour | Specifies hour as the time-span unit to which axis grid lines should be aligned. |
| Day | Specifies day as the time-span unit to which axis grid lines should be aligned. |
Property Paths
You can access this nested property as listed below:
Remarks
This property is available when the SeriesBase.ArgumentScaleType or SeriesBase.ValueScaleType property is set to TimeSpan, and the ScaleOptionsBase.ScaleMode property is set to Manual.
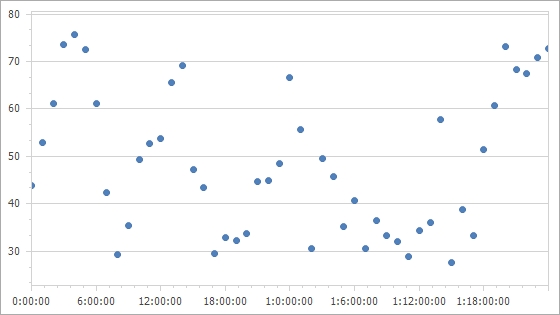
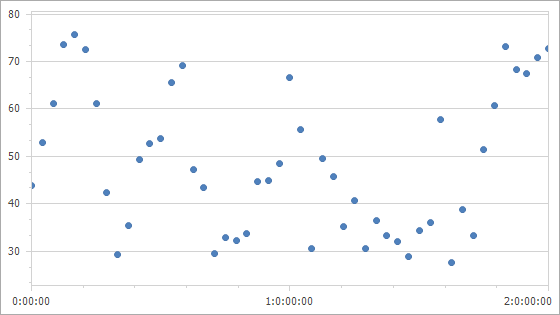
| GridAlignment=Hour , MeasureUnit=Hour | GridAlignment=Day , MeasureUnit=Hour |
|---|---|
 |
 |
To maintain time-span values at different detail levels, use the DateTimeScaleOptions.MeasureUnit property.
To change the step interval for grid lines and axis labels, specify the ScaleGridOptionsBase.GridSpacing property.
Example
The following example shows how to group minute-by-minute data into data points with a greater measurement unit (“Hour”).
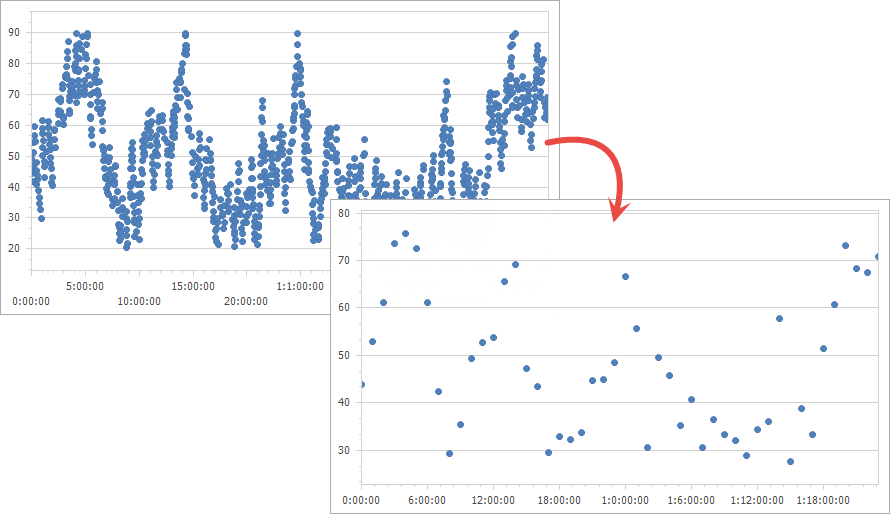
To do this, you can use the following code:
private void Form1_Load(object sender, EventArgs e) {
    XYDiagram diagram = chartControl1.Diagram as XYDiagram;
    if (diagram != null) {
        diagram.AxisX.TimeSpanScaleOptions.ScaleMode = ScaleMode.Manual;
        diagram.AxisX.TimeSpanScaleOptions.MeasureUnit = TimeSpanMeasureUnit.Hour;
        diagram.AxisX.TimeSpanScaleOptions.AggregateFunction = AggregateFunction.Average;
        diagram.AxisX.TimeSpanScaleOptions.GridSpacing = 6;
        diagram.AxisX.TimeSpanScaleOptions.GridAlignment = TimeSpanGridAlignment.Hour;
    }
}
The example uses the following API members:
| Member | Description |
|---|---|
| ScaleOptionsBase.ScaleMode | Gets or sets the scale mode for an axis. |
| TimeSpanScaleOptions.MeasureUnit | Gets or sets the detail level for time-span values. |
| ScaleGridOptionsBase.AggregateFunction | Gets or sets the value indicating the aggregate function that should be used to relieve data. |
| ScaleGridOptionsBase.GridSpacing | Gets or sets the interval between grid lines and major tickmarks. |