ChartCalculatedField Class
A calculated field.
Namespace: DevExpress.XtraCharts
Assembly: DevExpress.XtraCharts.v20.2.dll
NuGet Packages: DevExpress.Charts, DevExpress.WindowsDesktop.Charts
Declaration
public class ChartCalculatedField :
    ChartElementNamed,
    IChartCalculatedField,
ICalculatedFieldRelated API Members
The following members return ChartCalculatedField objects:
Remarks
Calculated fields allow you to evaluate values based on an expression and use them as a data source for series arguments,values, tooltips, crosshair label, and so on.
To add a calculated field to a Chart Control, add a ChartCalculatedField object to the ChartControl.CalculatedFields collection and specify the following parameters:
Expression - An expression is a string that, when parsed and processed, evaluates a value. Expressions can consist of column/field names in brackets, constants, operators, and functions. Refer to Criteria Language Syntax for information on expression syntax.
FieldType - Specifies the type of resulting values. The ChartCalculatedFieldType enumeration lists supported types.
Name (inherited from ChartElementNamed) - The calculated field’s unique name. Avoid dots in names because the Chart uses dots to access data source members. Use the name to specify series data members (for example, SeriesBase.ArgumentDataMember, SeriesBase.ValueDataMembers, SeriesBase.ToolTipHintDataMember, or SeriesBase.ColorDataMember). You can also use calculated field names to configure text patterns.
Optional parameters:
DataSource - Allows you to specify a custom data source to evaluate the specified expression. The calculated field and series must use the same data source. Series can obtain data from the chart’s data source or can be bound to a separate data source (see the Series.DataSource property). If the calculated field’s DataSource property is not specified, the field uses the corresponding series’s data source.
DataMember - Allows you to specify the name of the sub-list or table if the data source contains more than one distinct list of data items.
DisplayName - The calculated field’s display name that appears in the Chart Designer‘s Chart Data tab. If DisplayName is not specified, the Name property value is used instead.
Example
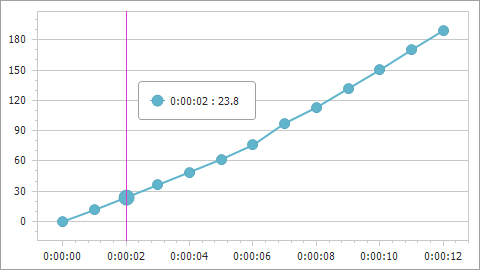
The following example shows how to create a calculated field and then use this field as a data source for a series. The field’s values are calculated by the following expression: [Time.Seconds] * [Velocity].
using DevExpress.XtraCharts;
using System;
using System.Collections.Generic;
using System.Windows.Forms;

namespace CalculatedFieldExample {
    public partial class Form1 : Form {
        //...
        private void Form1_Load(object sender, EventArgs e) {
            chartControl1.DataSource = GetDataPoints();

            ChartCalculatedField calcField = new ChartCalculatedField();
            calcField.Expression = "[Time.Seconds] * [Velocity]";
            calcField.FieldType = ChartCalculatedFieldType.Double;
            calcField.Name = "Displacement";
            chartControl1.CalculatedFields.Add(calcField);

            Series series = new Series("series", ViewType.Line);
            series.ArgumentDataMember = "Time";
            series.ValueDataMembers.AddRange("Displacement");
            chartControl1.Series.Add(series);
            XYDiagram diagram = chartControl1.Diagram as XYDiagram;
            diagram.AxisX.TimeSpanScaleOptions.MeasureUnit = TimeSpanMeasureUnit.Second;
            diagram.AxisY.WholeRange.AlwaysShowZeroLevel = false;
        }
        public List<DataPoint> GetDataPoints() {
            List<DataPoint> dataPoints = new List<DataPoint>() {
                new DataPoint (new TimeSpan(0, 0, 0), 10),
                new DataPoint (new TimeSpan(0, 0, 1), 11.46),
                new DataPoint (new TimeSpan(0, 0, 2), 11.90),
                //...
                // Other data points here.
                // ...
                new DataPoint (new TimeSpan(0, 0, 12), 15.756)
            };
            return dataPoints;
        }
    }
    public class DataPoint {
        public TimeSpan Time { get; set; }
        public double Velocity { get; set; }
        public DataPoint(TimeSpan time, double velocity) {
            this.Time = time;
            this.Velocity = velocity;
        }
    }
}