SecondaryAxisX Class
Represents the secondary X-axis within a chart control in 2D series, except for the Swift Plot.
Namespace: DevExpress.XtraCharts
Assembly: DevExpress.XtraCharts.v20.2.dll
NuGet Packages: DevExpress.Charts, DevExpress.WindowsDesktop.Charts
Declaration
public class SecondaryAxisX :
    AxisXBase,
    ISupportInitialize,
    IXtraSerializable,
ISupportIDRelated API Members
The following members return SecondaryAxisX objects:
Remarks
The SecondaryAxisX class represents the secondary axis of arguments (X-axis) within a chart control in 2D series (except for the Swift Plot). It inherits properties and methods from the base AxisXBase class, which implements the common X-axes functionality.
The collection of the SecondaryAxisX objects is represented by the SecondaryAxisXCollection class, and it can be accessed via the XYDiagram.SecondaryAxesX property of an XYDiagram object, which in its turn is exposed via the ChartControl.Diagram property.
A diagram‘s primary X-axis is represented by the AxisX class. And, for Swift Plot charts, the SwiftPlotDiagramSecondaryAxisX class provides a similar functionality.
For more information, refer to Primary and Secondary Axes.
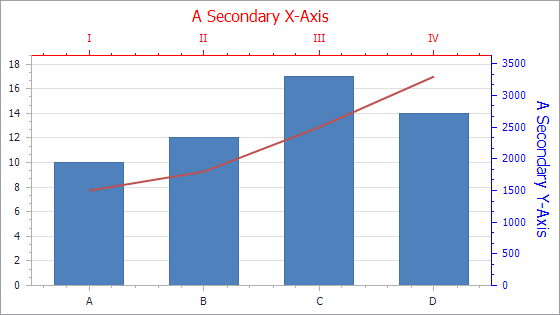
Example
This example demonstrates how to add secondary axes to a chart at runtime.
Use the following API members to add secondary axes:
| Member | Description |
|---|---|
| XYDiagram2D.SecondaryAxesX | Gets the collection of secondary X-axes. |
SecondaryAxisX |
Represents the secondary X-axis within a chart control in 2D series, except for the Swift Plot. |
| XYDiagram2D.SecondaryAxesY | Gets the collection of secondary Y-axes. |
| SecondaryAxisY | Represents the secondary Y-axis within a chart control in 2D series, except for the Swift Plot. |
using System;
using System.Drawing;
using System.Windows.Forms;
using DevExpress.XtraCharts;
// ...

private void Form1_Load(object sender, EventArgs e) {
    // Create a new chart.
    ChartControl chartControl1 = new ChartControl();

    // Create two series.
    Series series1 = new Series("Series 1", ViewType.Bar);
    Series series2 = new Series("Series 2", ViewType.Line);

    // Add points to them, with their arguments different.
    series1.Points.Add(new SeriesPoint("A", 10));
    series1.Points.Add(new SeriesPoint("B", 12));
    series1.Points.Add(new SeriesPoint("C", 17));
    series1.Points.Add(new SeriesPoint("D", 14));
    series2.Points.Add(new SeriesPoint("I", 1500));
    series2.Points.Add(new SeriesPoint("II", 1800));
    series2.Points.Add(new SeriesPoint("III", 2500));
    series2.Points.Add(new SeriesPoint("IV", 3300));

    // Add both series to the chart.
    chartControl1.Series.AddRange(new Series[] { series1, series2 });

    // Hide the legend (optional).
    chartControl1.Legend.Visibility = DevExpress.Utils.DefaultBoolean.False;

    // Create two secondary axes, and add them to the chart's Diagram.
    SecondaryAxisX myAxisX = new SecondaryAxisX("my X-Axis");
    SecondaryAxisY myAxisY = new SecondaryAxisY("my Y-Axis");

    ((XYDiagram)chartControl1.Diagram).SecondaryAxesX.Add(myAxisX);
    ((XYDiagram)chartControl1.Diagram).SecondaryAxesY.Add(myAxisY);

    // Assign the series2 to the created axes.
    ((LineSeriesView)series2.View).AxisX = myAxisX;
    ((LineSeriesView)series2.View).AxisY = myAxisY;

    // Customize the appearance of the secondary axes (optional).
    myAxisX.Title.Text = "A Secondary X-Axis";
    myAxisX.Title.Visibility = DevExpress.Utils.DefaultBoolean.True;
    myAxisX.Title.TextColor = Color.Red;
    myAxisX.Label.TextColor = Color.Red;
    myAxisX.Color = Color.Red;

    myAxisY.Title.Text = "A Secondary Y-Axis";
    myAxisY.Title.Visibility = DevExpress.Utils.DefaultBoolean.True;
    myAxisY.Title.TextColor = Color.Blue;
    myAxisY.Label.TextColor = Color.Blue;
    myAxisY.Color = Color.Blue;

    // Add the chart to the form.
    chartControl1.Dock = DockStyle.Fill;
    this.Controls.Add(chartControl1);
}