AxisLabel Class
Defines the settings of auto-generated axis labels.
Namespace: DevExpress.XtraCharts
Assembly: DevExpress.XtraCharts.v20.2.dll
NuGet Packages: DevExpress.Charts, DevExpress.WindowsDesktop.Charts
Declaration
Related API Members
The following members return AxisLabel objects:
Remarks
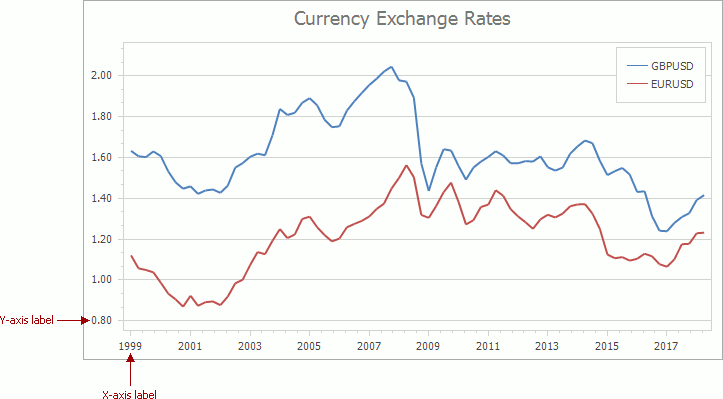
The Chart control automatically generates axis labels based on the underlying data. You can customize labels individually for each axis.
Access to Label Options
Use the axis’s Axis2D.Label property to access label settings.
AxisLabel axisXLabel = ((XYDiagram)chartControl.Diagram).AxisX.Label;
AxisLabel axisYLabel = ((XYDiagram)chartControl.Diagram).AxisY.Label;
Note that you should cast the ChartControl.Diagram property to the diagram type that the chart depicts:
| Diagram | Type |
|---|---|
| XY diagram | XYDiagram |
| Swift plot diagram | SwiftPlotDiagram |
| Gantt diagram | GanttDiagram |
Text Format
The TextPattern property specifies the text format for auto-generated labels.
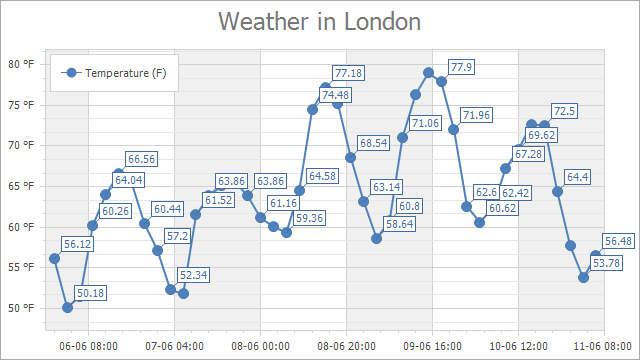
The following code shows how to format label text as in the image above:
AxisLabel axisXLabel = ((XYDiagram)chartControl.Diagram).AxisX.Label;
AxisLabel axisYLabel = ((XYDiagram)chartControl.Diagram).AxisY.Label;

axisXLabel.TextPattern = "{A:dd-MM HH:mm}";
axisYLabel.TextPattern = "{V} °F";
Patterns can contain regular text (displayed as is) and value placeholders in braces. To format numeric and date/time values, you can apply Format Specifiers. Use a colon to separate a placeholder and its format specifier.
The following table contains the available placeholders:
| Placeholder | Description |
|---|---|
| Placeholders available for arguments’ axis | |
| {A} | Use it to display series point arguments. |
| Placeholders available for values’ axis | |
| {V} | Use it to display series point values. |
| {VP} | Use it to display series point values as a percentage. |
Layout
The Chart control plots axis labels next to major grid lines. Set the ScaleGridOptionsBase.AutoGrid property to false and use the ScaleGridOptionsBase.GridSpacing property to specify how frequently the Chart control should draw grid lines.
The built-in Resolve Overlapping algorithm rotates, hides, and staggers labels to display them without overlaps. The ResolveOverlappingOptions property provides access to the algorithm settings.
To manually rotate labels, use the Angle property. To arrange labels in staggered order, enable Staggered.
The TextAlignment property defines how to align the label text.
AxisLabel axisXLabel = ((XYDiagram)chartControl.Diagram).AxisX.Label;

axisXLabel.ResolveOverlappingOptions.AllowHide = true;
axisXLabel.ResolveOverlappingOptions.AllowRotate = true;
//axisXLabel.Angle = 0;
axisXLabel.ResolveOverlappingOptions.AllowStagger = true;
//axisXLabel.Staggered = true;
axisXLabel.ResolveOverlappingOptions.MinIndent = 5;
axisXLabel.TextAlignment = System.Drawing.StringAlignment.Center;
Appearance
Text
The AxisLabel class inherits the TitleBase class properties that allow you to configure axis label text appearance:
Border
Use the Border property to access border settings:
Background
The following properties specify label background settings:
AxisLabel axisXLabel = ((XYDiagram)chartControl.Diagram).AxisX.Label;

axisXLabel.EnableAntialiasing = DevExpress.Utils.DefaultBoolean.True;
axisXLabel.Font = new System.Drawing.Font("Tahoma", 10, System.Drawing.FontStyle.Regular);
axisXLabel.TextColor = System.Drawing.Color.Black;

axisXLabel.Border.Visibility = DevExpress.Utils.DefaultBoolean.True;
axisXLabel.Border.Color = System.Drawing.Color.DarkSlateGray;
axisXLabel.Border.Thickness = 1;

axisXLabel.FillStyle.FillMode = FillMode.Solid;
axisXLabel.BackColor = System.Drawing.Color.LightGray;
Advanced Customization
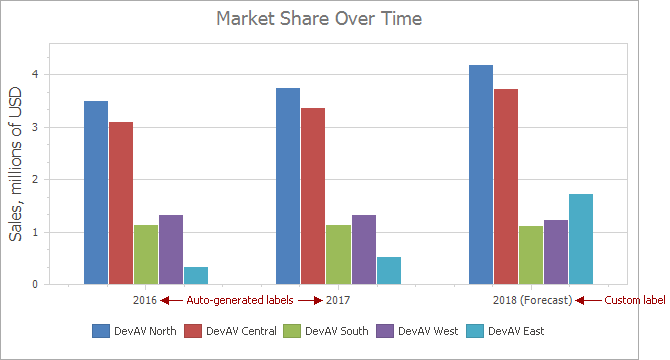
Use custom labels to change an auto-generated label’s text or add additional labels to an axis.
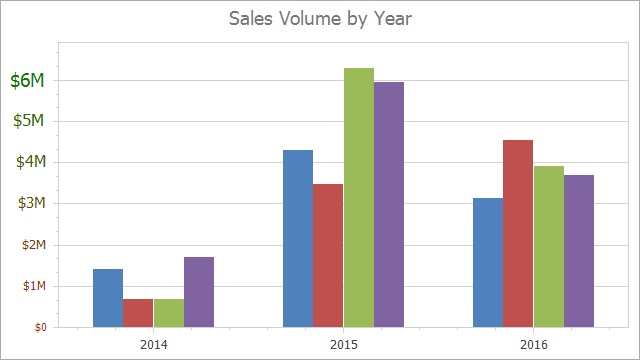
In addition to custom labels, you can use the ChartControl.CustomDrawAxisLabel event to individually customize each axis label text and appearance based on label values. In the following image, CustomDrawAxisLabel is used to customize the y-axis labels:
Examples
- How to: Create Custom Axis Labels
- How to: Change the Display Format for Axis Labels (Runtime Sample)
- How to: Display Axis Labels Between Tickmarks
- How to: Individually Customize Axis Labels