BarSeriesView.BarWidth Property
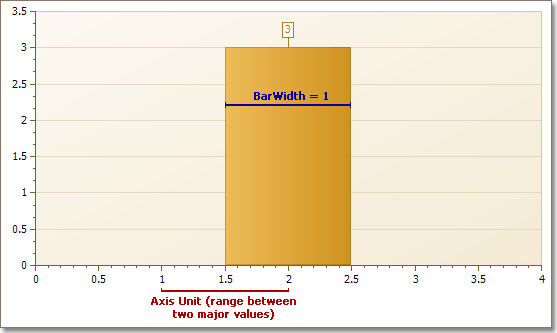
Specifies the width of bars in Bar series, as a fraction of axis units.
Namespace: DevExpress.XtraCharts
Assembly: DevExpress.XtraCharts.v19.1.dll
Declaration
[XtraSerializableProperty]
[XtraChartsLocalizableCategory(XtraChartsCategory.Layout)]
public double BarWidth { get; set; }Property Value
| Type | Description |
|---|---|
| Double | A Double value that specifies the bar’s width in fractions of axis units, where an axis unit is the distance between two major values on the axis. This value should be greater than or equal to 0. |
Remarks
The BarWidth property specifies the bar width for all Bar series, as a fraction of an axis measurement unit (the value that the NumericScaleOptions.MeasureUnit or DateTimeScaleOptions.MeasureUnit property specifies). This means that the distance is auto-adjusted when the chart is resized.
For 3D Bar series, the width of bars is specified via the Bar3DSeriesView.BarWidth property.
Example
This example demonstrates how to create a histogram chart with a given number of bins.
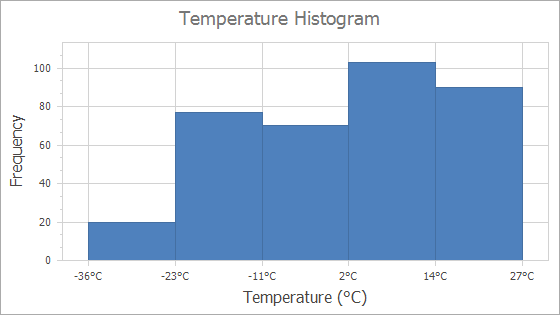
private void Form1_Load(object sender, EventArgs e) {
    // Load data to a chart.
    chartControl1.DataSource = LoadDataTableFromXml("..\\..\\Data\\CityWeather.xml", "CityWeather");
    Series series = new Series();
    series.ArgumentDataMember = "Temperature";
    SideBySideBarSeriesView view = series.View as SideBySideBarSeriesView;
    view.Border.Visibility = DevExpress.Utils.DefaultBoolean.True;
    view.BarWidth = 1;
    chartControl1.Series.Add(series);
    // Configure histogram options.
    XYDiagram diagram = chartControl1.Diagram as XYDiagram;
    NumericScaleOptions scaleOptions = diagram.AxisX.NumericScaleOptions;
    scaleOptions.AggregateFunction = AggregateFunction.Histogram;
    scaleOptions.ScaleMode = ScaleMode.Interval;
    scaleOptions.IntervalOptions.DivisionMode = IntervalDivisionMode.Count;
    scaleOptions.IntervalOptions.Count = 5;
    scaleOptions.IntervalOptions.GridLayoutMode = GridLayoutMode.GridAndLabelShifted;
    diagram.AxisX.Label.TextPattern = "{A:F0}°C";
    diagram.AxisX.GridLines.Visible = true;
}
static DataTable LoadDataTableFromXml(string fileName, string tableName) {
    DataSet xmlDataSet = new DataSet();
    xmlDataSet.ReadXml(fileName);
    return xmlDataSet.Tables[tableName];
}
The following API members configure the histogram options:
| Member | Description |
|---|---|
| ScaleGridOptionsBase.AggregateFunction | Gets or sets the value indicating the aggregate function that should be used to relieve data. |
| ScaleOptionsBase.ScaleMode | Gets or sets the scale mode for an axis. |
| NumericScaleOptions.IntervalOptions | Stores options for numeric axis when its ScaleMode is Interval. |
| NumericIntervalOptions.DivisionMode | Specifies how to divide axis scale into intervals. |
| NumericIntervalOptions.Count | Gets or sets the number of intervals when DivisionMode is Count. |
| NumericIntervalOptions.GridLayoutMode | Gets or sets the value that specifies the alignment of grid lines, major tickmarks and axis labels. |