DxChartZoomAndPanSettings.AllowDragToZoom Property
Specifies whether users can drag the mouse to select a chart area for zooming.
Namespace: DevExpress.Blazor
Assembly: DevExpress.Blazor.v25.1.dll
NuGet Package: DevExpress.Blazor
Declaration
[DefaultValue(true)]
[Parameter]
public bool AllowDragToZoom { get; set; }
Property Value
| Type | Default | Description |
|---|---|---|
| Boolean | true |
|
Remarks
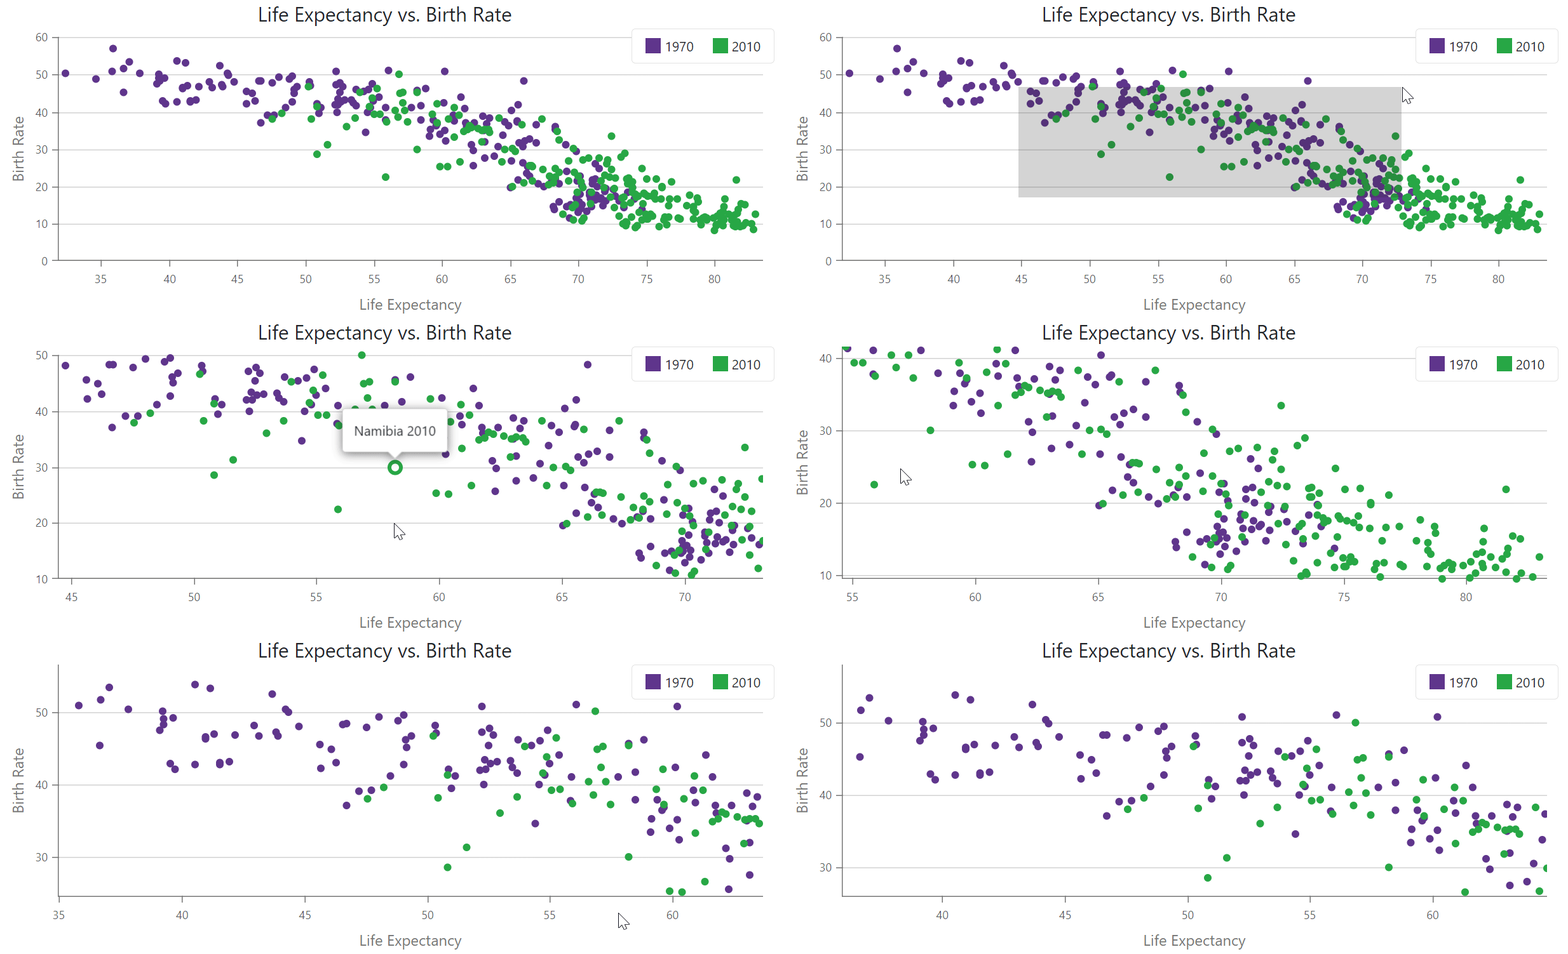
In DxChart, users can drag the mouse to select a chart area for zooming. To enable this functionality, set the AllowDragToZoom property to true.
To pan the chart in this case, users should drag the mouse pressing the key specified by the PanKey property (the default key is Shift).
The following example zooms the selected area and pans the chart when the Shift key is pressed:
<DxChart Data="@DataSource"
         Width="100%">
    <DxChartTitle Text="Life Expectancy vs. Birth Rate" />
    <DxChartLegend Position="RelativePosition.Inside"
                   VerticalAlignment="VerticalEdge.Top"
                   HorizontalAlignment="HorizontalAlignment.Right" />
    <DxChartScatterSeries ArgumentField="@((BirthLife i) => i.LifeExp)"
                          ValueField="@((BirthLife i) => i.BirthRate)"
                          Filter="@((BirthLife i) => i.Year == 1970)"
                          Name="1970">
        <DxChartSeriesPoint Size="8" />
    </DxChartScatterSeries>
    <DxChartScatterSeries ArgumentField="@((BirthLife i) => i.LifeExp)"
                          ValueField="@((BirthLife i) => i.BirthRate)"
                          Filter="@((BirthLife i) => i.Year == 2010)"
                          Name="2010">
        <DxChartSeriesPoint Size="8" />
    </DxChartScatterSeries>
    <DxChartArgumentAxis>
        <DxChartAxisTitle Text="Life Expectancy" />
    </DxChartArgumentAxis>
    <DxChartValueAxis>
        <DxChartAxisTitle Text="Birth Rate" />
    </DxChartValueAxis>
    <DxChartTooltip Enabled="true">
        <div style="margin: 0.75rem">
            <div>@(((BirthLife)context.Point.DataItems.First()).Country) @(((BirthLife)context.Point.DataItems.First()).Year)</div>
        </div>
    </DxChartTooltip>
    <DxChartZoomAndPanSettings ArgumentAxisZoomAndPanMode="ChartAxisZoomAndPanMode.Both"
                               ValueAxisZoomAndPanMode="ChartAxisZoomAndPanMode.Both"
                               AllowDragToZoom="true"
                               AllowMouseWheel="true"
                               PanKey="ChartEventPanKey.Shift" />
</DxChart>

@code {
    IEnumerable<BirthLife> DataSource = Enumerable.Empty<BirthLife>();
    protected override void OnInitialized() {
        DataSource = ChartBirthLifeDataProvider.GenerateData();
    }
}

For more information about zoom, refer to the following topic: Zoom in Blazor Chart.