How to: Bind a Web Chart to an ASPxPivotGrid
- 3 minutes to read
This tutorial describes how to create a Web page with two linked controls: an ASPxPivotGrid bound to a data source, and a WebChartControl bound to that pivot grid.
Note that in order to synchronize both controls during callbacks, they should both be placed within an ASPxCallbackPanel, and have their EnableCallbacks properties disabled.
Tip
A complete sample project is available in the DevExpress Code Examples database at http://www.devexpress.com/example=E1242.
This tutorial consists of the following sections.
Bind a Pivot Grid to Data
- Create a new ASP.NET Web Application (Visual Studio 2012, 2013, 2015, 2017 or 2019), or open an existing one.
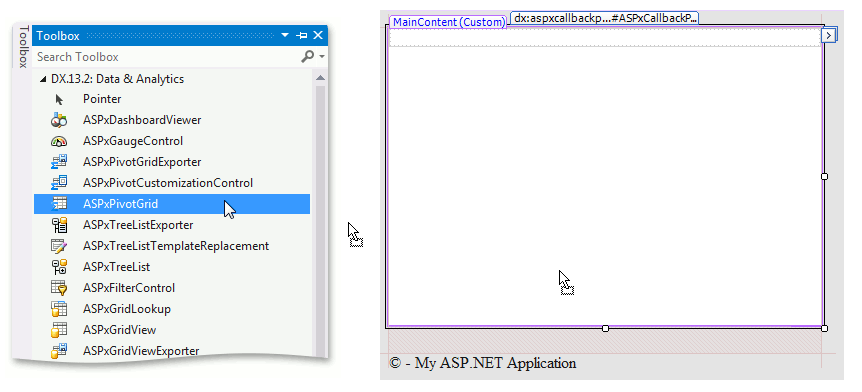
Drop the ASPxPivotGrid control from the DX.19.1: Data & Analytics toolbox tab onto the Web page.
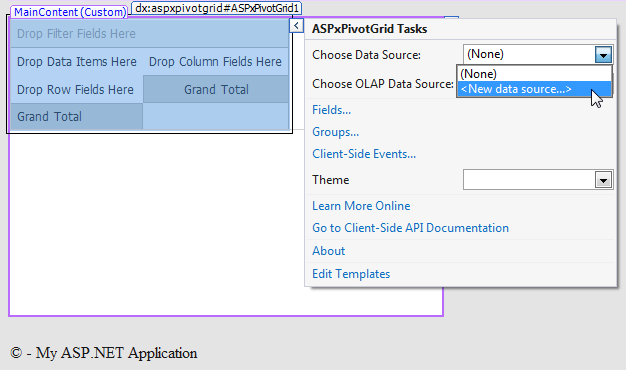
To bind the pivot grid to a database, click its smart tag, and in the invoked actions list, expand the drop-down menu for the Choose Data Source entry.
And, click New data source… link.
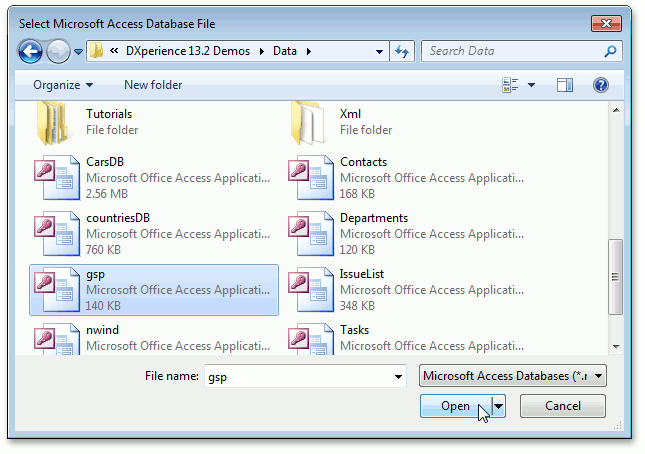
Then, proceed with the steps of the Data Source Configuration Wizard, to connect to your data source. In this example, we’ll use the gsp.mdb file (which is shipped with the installation of the ASP.NET Chart Control), copied to the application’s folder.
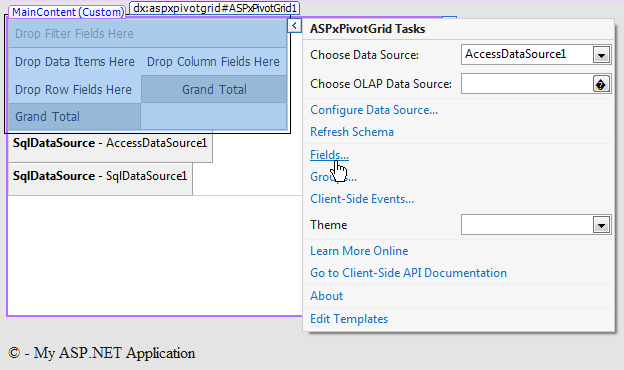
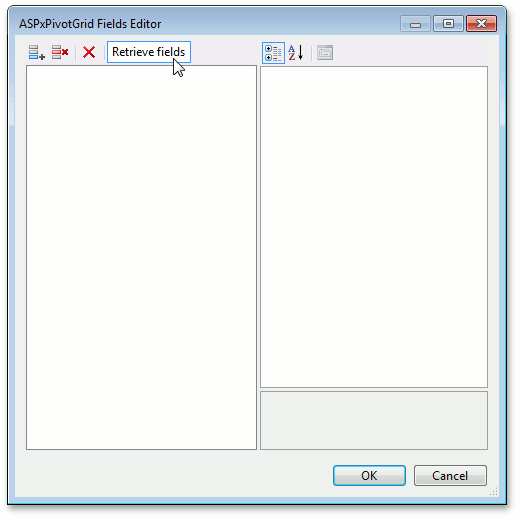
After you’ve connected to a data source, click the pivot grid’s smart tag again, and in its actions list, choose Fields….
In the invoked dialog, click Retrieve fields.
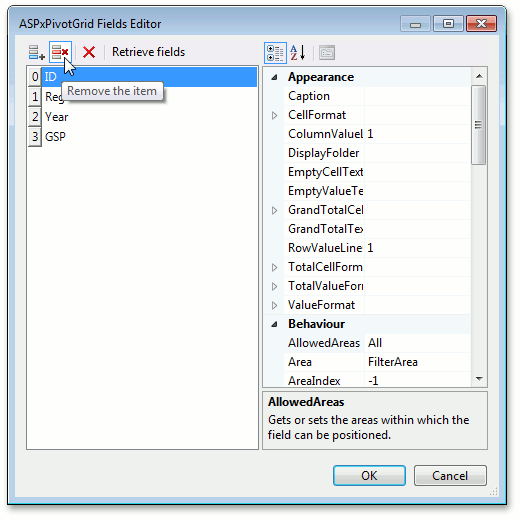
Among the obtained fields, remove the ID field, since it is unnecessary in this project.
Then, for each field, specify its Area property. In particular:
- for the Region field, set this property to ColumnArea;
- for the Year field, set this property to RowArea;
- and, for the GSP field, set this property to DataArea.
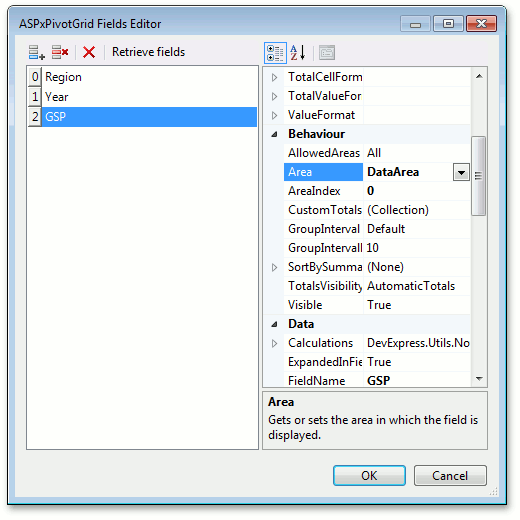
To close the dialog, and apply the changes, click OK.
Now, the pivot grid has been successfully bound to data, and it’s only left to create a Web chart bound to this grid. This is explained in the next section of this tutorial.
Bind a Chart to the Pivot Grid
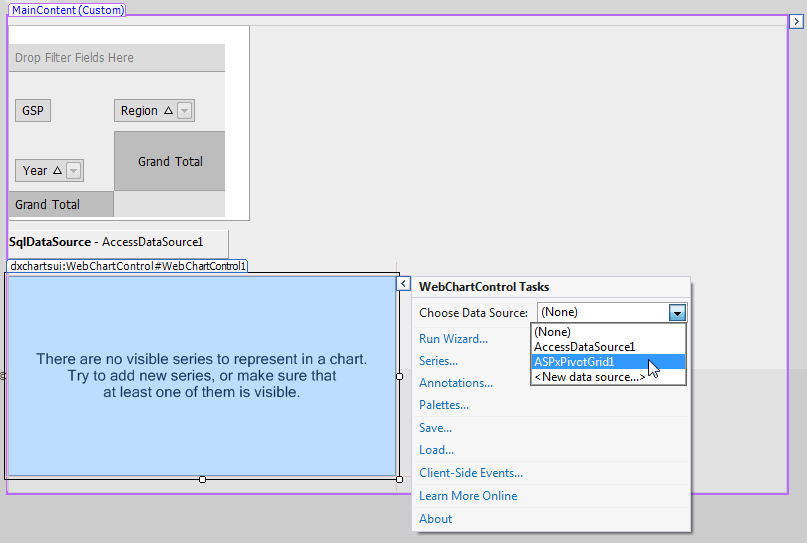
- Add a chart to the Web page.
Then, click its smart tag, and in the invoked actions list, expand the Choose Data Source drop-down menu, and select the ASPxPivotGrid1.
- Then, you can adjust chart’s options, e.g. enable tooltips by setting the WebChartControl.ToolTipEnabled to true, and disable a crosshair cursor setting the WebChartControl.CrosshairEnabled to false.
Get the Result
The WebChartControl has now successfully bound to the ASPxPivotGrid. Run the application, and view the result.
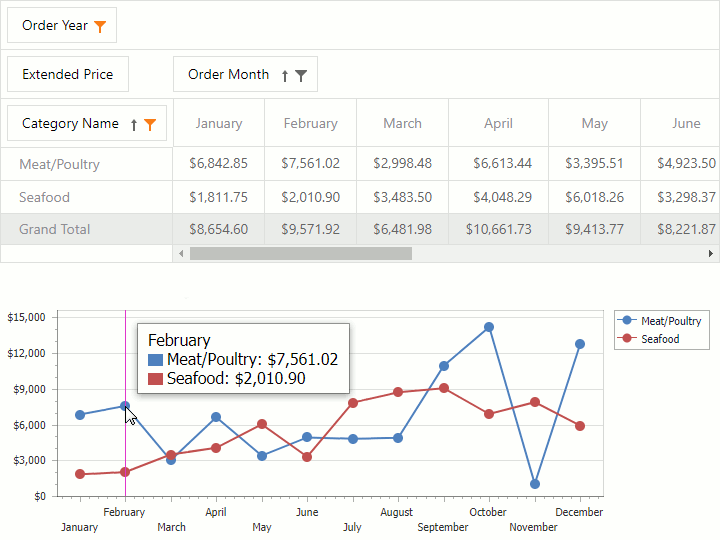
Note that after you filter the grid’s columns and rows right in the browser, this has an immediate effect on the linked chart.