How to: Add a Chart to a Web Page (Runtime Sample)
- 3 minutes to read
This tutorial demonstrates how a chart can be generated and shown in a web page with a button click. For an alternative approach to this task, refer to How to: Add a Chart to an ASPxCallbackPanel during its Callback (Runtime Sample).
To demonstrate how this can be done, do the following.
- Create a new ASP.NET Web Application (Visual Studio 2012, 2013, 2015, 2017 or 2019), or open an existing one.
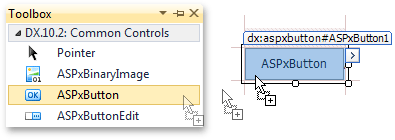
Switch to the Design view of the Default.aspx page, and from the DX.19.1: Common Controls toolbox tab, drop an ASPxButton onto the page. We’ll handle its Click event, to generate a web chart.
Add the required assemblies to the project.
Note that if you prefer that the assemblies be added automatically (by dropping a WebChartControl instance onto the page), this affects your web application’s Web.config file. To learn about the changes being made to it, refer to Adding a Web Chart.
Now, double-click the ASPxButton1, to handle its Click event. Add the following code to the event handler.
Note that prior to accessing elements and properties of a dynamically created WebChartControl, it should be added to the Page.Form.Controls collection.
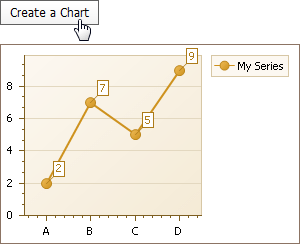
using System;
using DevExpress.XtraCharts;
using DevExpress.XtraCharts.Web;
// ...

protected void ASPxButton1_Click(object sender, EventArgs e) {
    // Create a WebChartControl instance.
    WebChartControl WebChartControl1 = new WebChartControl();

    // Add the chart to the form.
    // Note that a chart isn't initialized until it's added to the form's collection of controls.
    this.form1.Controls.Add(WebChartControl1);

    // Create a line series and add points to it.
    Series series1 = new Series("My Series", ViewType.Line);
    series1.Points.Add(new SeriesPoint("A", new double[] { 2 }));
    series1.Points.Add(new SeriesPoint("B", new double[] { 7 }));
    series1.Points.Add(new SeriesPoint("C", new double[] { 5 }));
    series1.Points.Add(new SeriesPoint("D", new double[] { 9 }));

    // Add the series to the chart.
    WebChartControl1.Series.Add(series1);
}
Run the web application, and click the ASPxButton1 to see the resulting chart.
Tip
A complete sample project is available in the DevExpress Code Examples database at http://www.devexpress.com/example=E1171.