Bind a Report to a Join-Based Federated Data Source
- 3 minutes to read
This topic describes how to create a federated data source that joins data from multiple data sources into a single query.
Create a Report and Data Sources
Add a SQL data source that provides information about categories. For instance, bind to the Northwind database’s Categories table. You can use the nwind.mdb file from the XtraReports installation (the default path is C:\Users\Public\Public Documents\DevExpress Demos 19.2\Components\Data\nwind.mdb).
Add an Excel data source that provides information about products.
Create Data Federation and Bind the Report to It
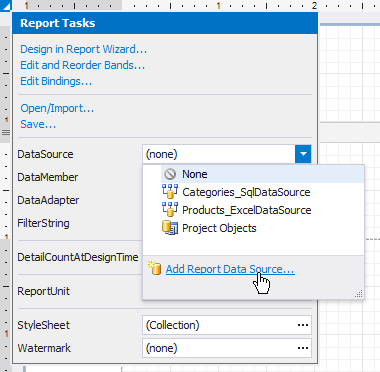
Click the report’s smart tag, expand the DataSource property’s drop-down menu and click Add Report Data Source.
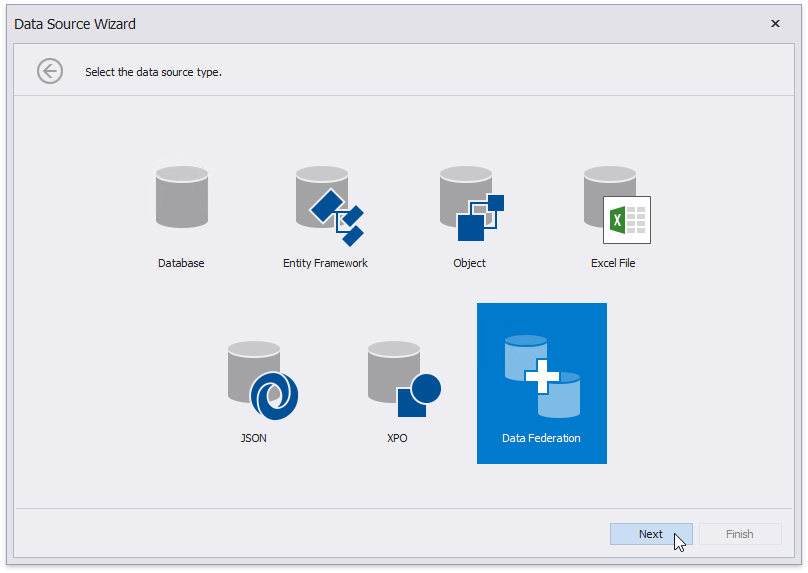
In the invoked Data Source Wizard, select Data Federation and click Next.
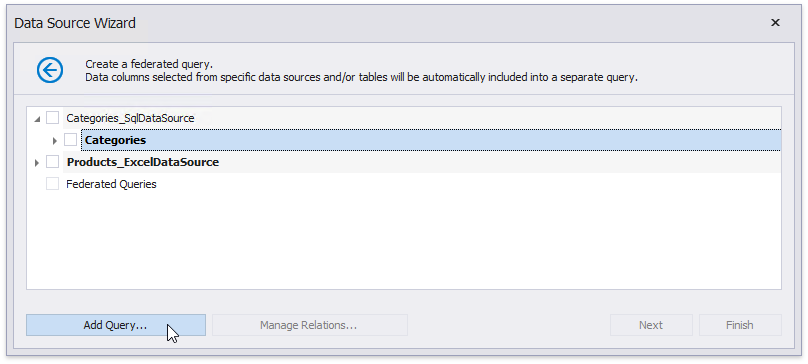
On the next page, click Add Query.
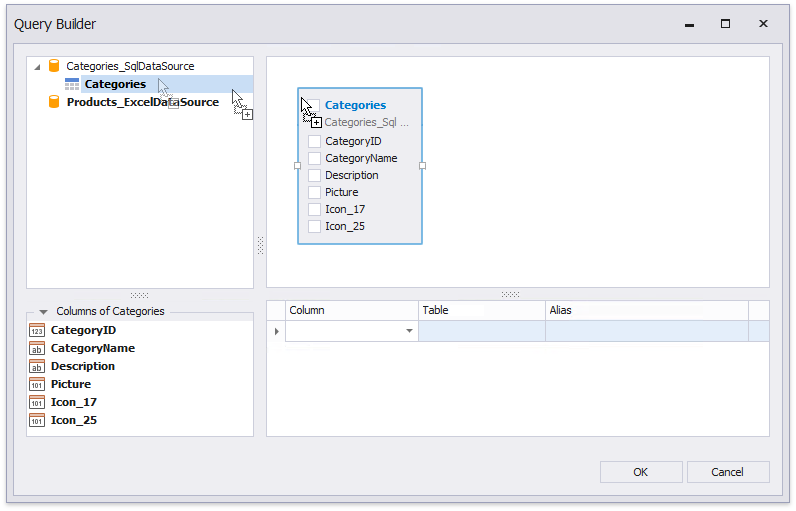
In the invoked Query Builder (adapted to federated data sources), drag and drop the Categories table onto the design surface.
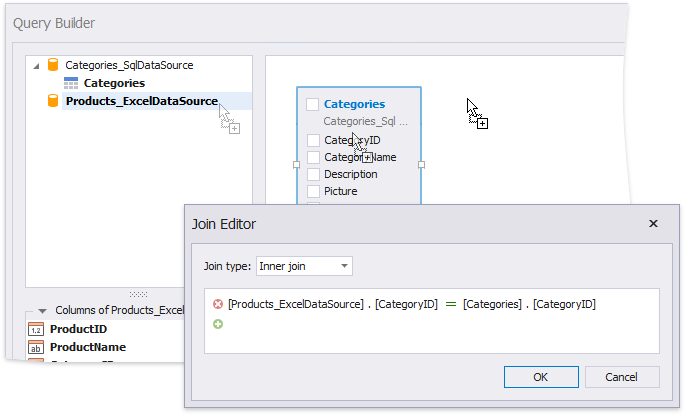
Drag and drop the Excel data source onto the design surface. In the invoked Join Editor, select the Inner join type and create a join relationship based on the CategoryID key field.
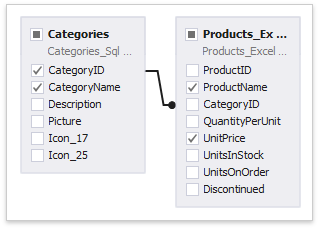
Enable check boxes for the data fields you want to include in the query result set.
Click OK to close the Query Builder. Click Finish to complete the Data Source Wizard.
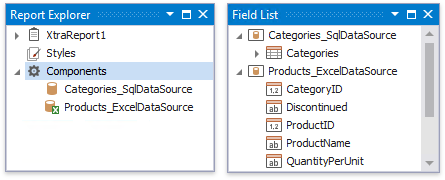
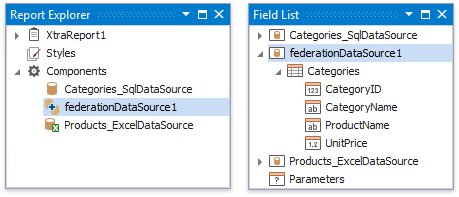
The Wizard creates a new FederationDataSource that includes the single Categories query. This data source becomes available in the Report Explorer‘s Components node. The Field List reflects the data source structure.
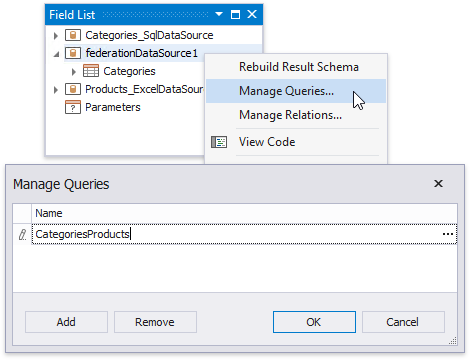
The federated query’s default name equals to the main table’s name (the Categories table in this tutorial). You can rename this query in the Manage Queries dialog. To invoke it, right-click the data source in the Field List or Report Explorer and select Manage Queries in the context menu.
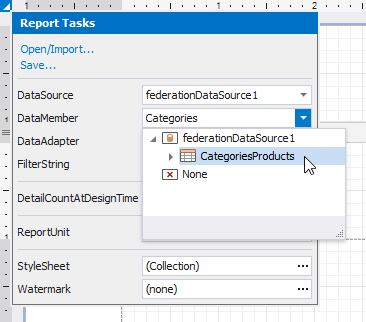
Once you rename the query, update the report’s DataMember property.
Design the Report Layout
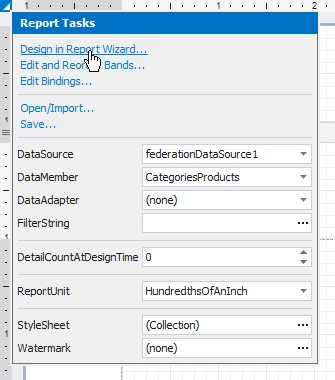
Click the report’s smart tag and select Design in Report Wizard.
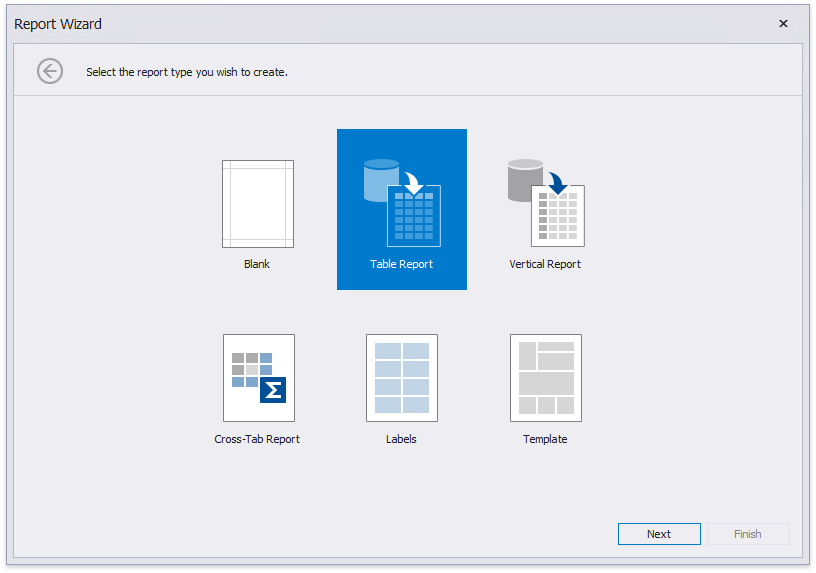
In the invoked Report Wizard, select Table Report and click Next.
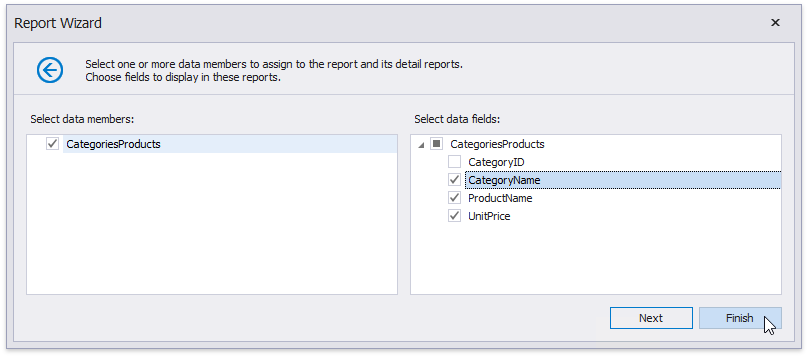
Select data fields to display in the report and click Finish. You can also go to the next page to continue layout creation.
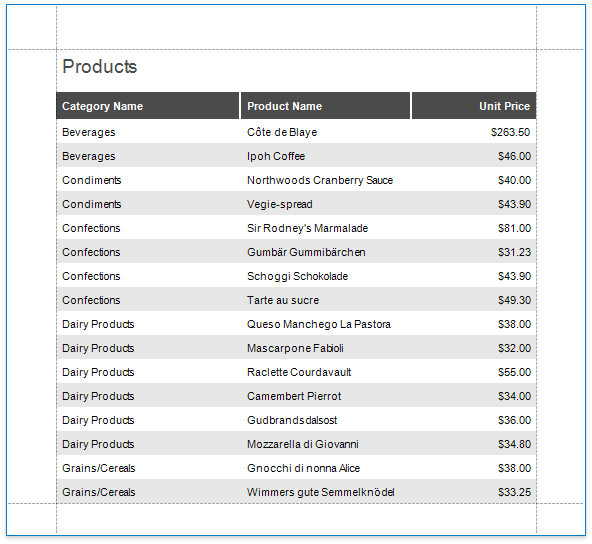
The resulting layout looks similar to the following image:
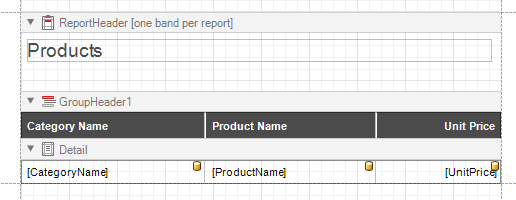
Switch to the Preview tab to see the report document.