Use Charts to Visualize Data in Report Groups
- 3 minutes to read
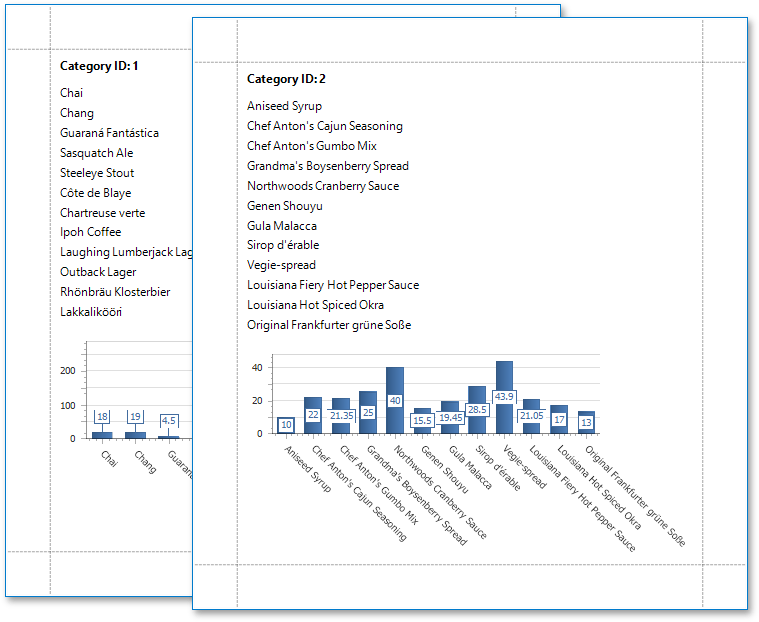
This tutorial describes how to use charts to visualize data in each report group. Choose a design-time or runtime approach to perform this task.
Group Report Data
Do the following to group data in a report:
- Open an existing reporting application or create a new one.
- Bind the report to the Northwind database’s “Products” table (the nwind.mdb file included in the XtraReports installation).
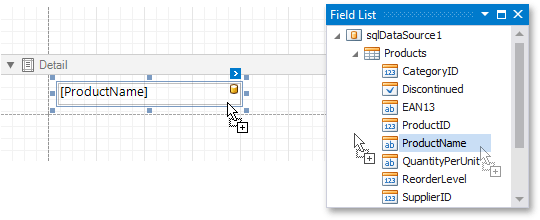
Drop the “ProductName” field from the Field List onto the report’s Detail band.
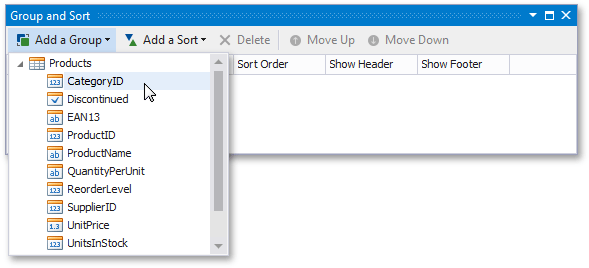
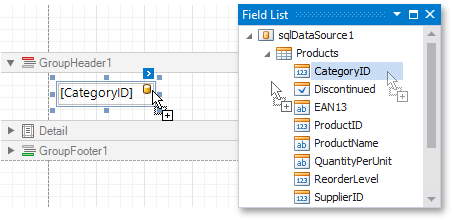
In the Group and Sort panel, click Add a Group and select group criteria (for example, the “CategoryID” field).
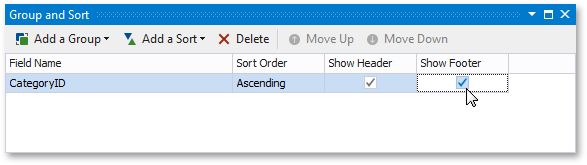
Enable the Show Footer check box to add a Group Footer to the report.
Drop the “CategoryID” field onto the Group Header to display group titles in the report.
Create a Chart
Do the following to add a chart to the report:
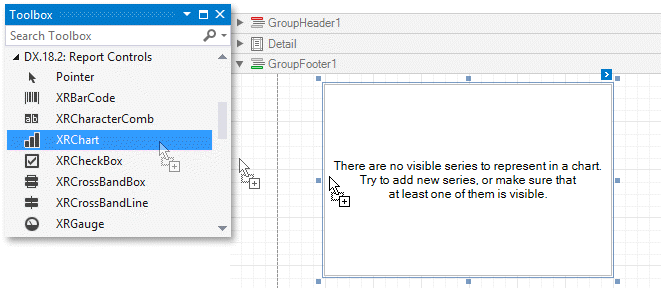
Drop the XRChart control from the DX.18.2: Report Controls Toolbox tab onto the Group Footer.
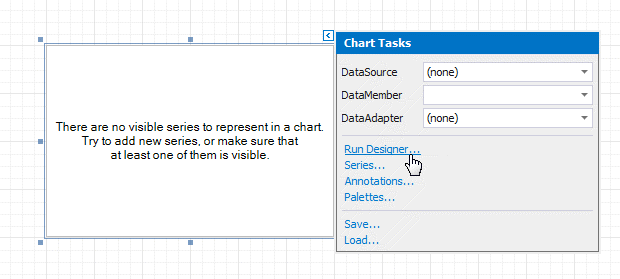
The Chart Designer is invoked. If it is not, click the chart’s smart tag and select the Run Designer… command.
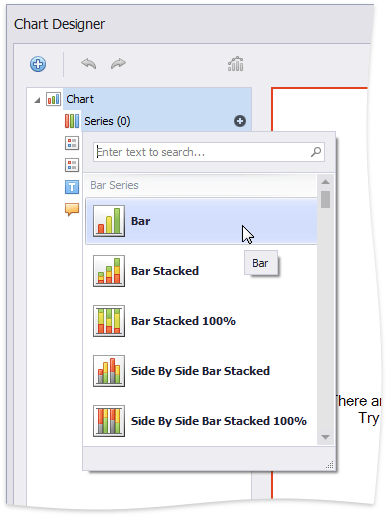
In the Chart Designer, click the plus button to add a new series…
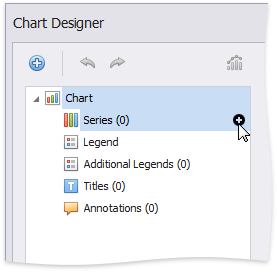
…and select a series view.
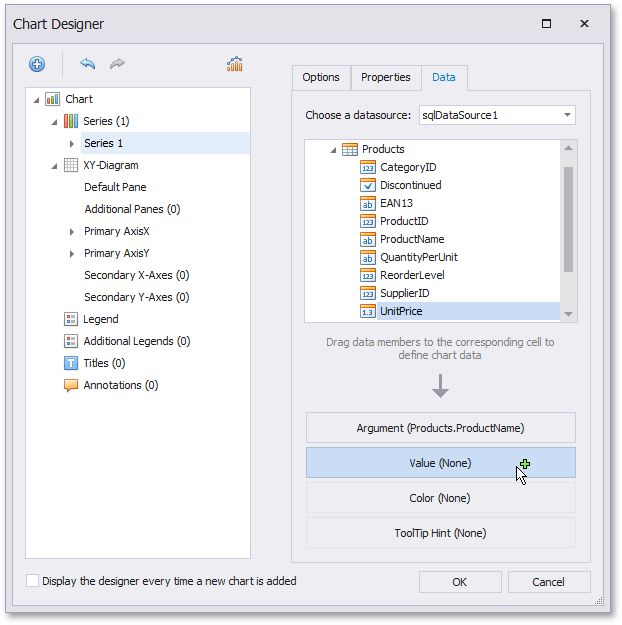
Select the created series and switch to the Data tab.
On this tab, drop the “ProductName” field onto the Argument area and the “UnitPrice” field onto the Value area.
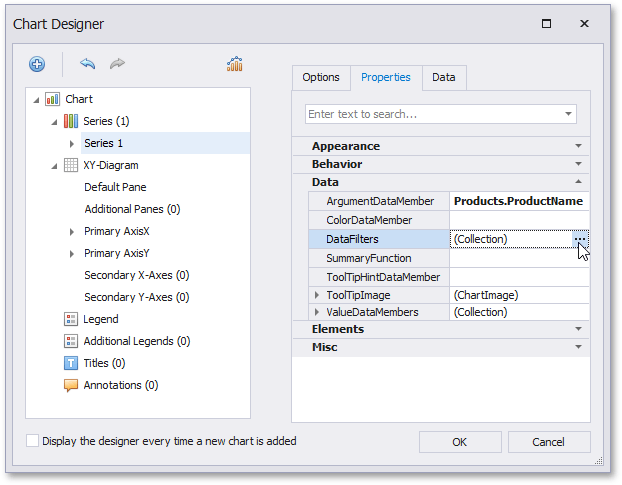
Switch to the Properties tab and click the DataFilters property’s ellipsis button.
In the Data Filter Collection Editor, click Add to create a new filter.
Set the filter’s ColumnName and ValueBinding properties to the “CategoryID” field that is used as group criteria in the report.
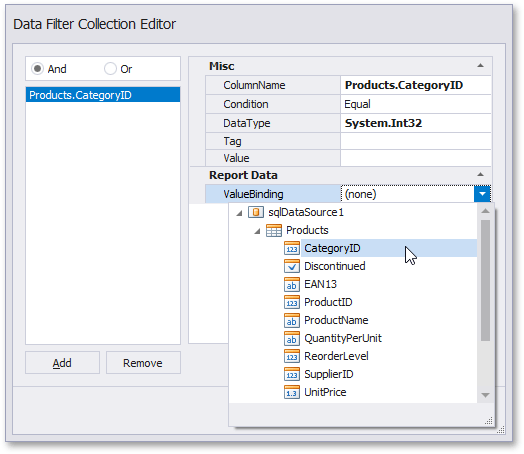
Only the ValueBinding setting is taken into account when the Value and ValueBinding properties are specified for a data filter.
Runtime Approach
Handle the XRChart control’s XRControl.BeforePrint event to filter a chart’s data in code.
private void xrChart1_BeforePrint(object sender, System.Drawing.Printing.PrintEventArgs e)
{
    XRChart xrc = (XRChart)sender;

    // Gets the grouping field's current value.
    // For the master-detail report, use DetailBand.GetCurrentColumnValue in the detail band instead.
    string filter_value = GetCurrentColumnValue("TheGroupingField").ToString();

    // Clears the filters that may have been set earlier.
    xrc.Series[0].DataFilters.Clear();

    // Creates and adds a new filter to the "TheGroupingField" data field
    // that has the type System.String.
    // The condition is that the data value equals the filter_value parameter.
    xrc.Series[0].DataFilters.Add(new DataFilter("TheGroupingField", "System.String",
        DataFilterCondition.Equal, filter_value));
}
You can use the AND or OR conjunction operator to combine several filters. To do this, specify the DataFilterCollection object’s DataFilterCollection.ConjunctionMode property (or the series SeriesBase.DataFiltersConjunctionMode property).
The displayed series only contains the data points that meet the filter conditions when one or more data filter objects are created for a series.