Add Controls to a Report
- 4 minutes to read
You can include data in a report after connecting the report to a data source (and optionally, customizing this data using the Query Builder).
Adding Report Controls
To list data source content in your report, drag the corresponding entity from the Field List and drop it onto the report’s detail band. Dropping a field onto a report’s surface creates a new report control bound to the corresponding field.

You can add other controls to your report using Visual Studio’s Toolbox. Its DX.18.2: Report Controls tab contains report elements that you can add to a report for displaying content such as text, images, charts or barcodes.

Note
The installation does not always add the corresponding tabs to the Toolbox correctly.
See How to resolve issues with Toolbox items for details on how to resolve this issue.
This document describes how to add the most commonly used controls to a report. See Use Report Controls for a list of the available controls.
Displaying Text
Use the following controls to display text in a report:
-
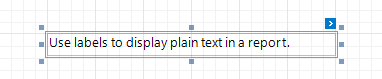
Displays plain text in a report. You can customize the font settings for a label’s entire content only.
-
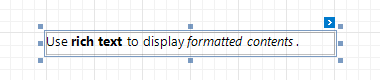
Displays rich text in a report. You can apply different font settings to the control’s contents and load contents from an external RTF file.
-
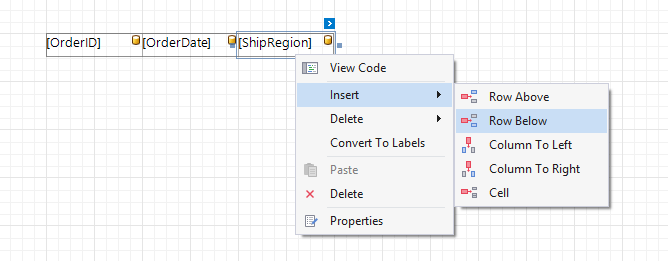
Contains any number of XRTableCell controls arranged in one or more rows. Each table cell can display plain text or contain other controls.
-
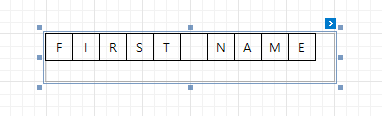
Displays each character in a separate cell. This is useful when creating printed forms.
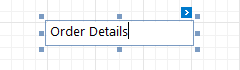
Double-clicking any of these controls invokes an in-place editor where you can enter text and format it.

Use the corresponding toolbar to access the selected control’s font settings.

Tip
You can open this toolbar by selecting View | Toolbars | XtraReports if it is missing in Visual Studio.
Press CTRL+Enter to submit text changes and exit the control’s in-place editing mode.
Labels and other text-oriented controls can display the following content:
Static content
A control’s content does not change once it is specified in a published document.
Dynamic content
A connected data source supplies this content. In a published document, it changes according to the printed data source record.
You can format dynamic content using a control’s smart tag.
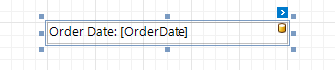
Mixed content
You can combine labels’ and other text-oriented controls’ static and dynamic content within the same control.
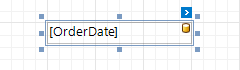
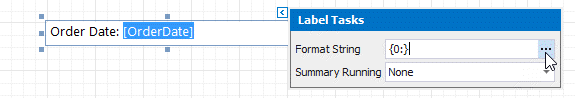
You can use the in-place editor to refer to data source fields by enclosing them in square brackets.
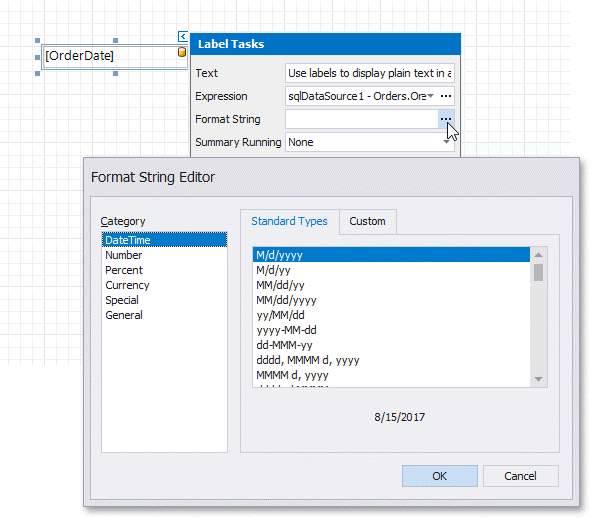
You can format a data field’s value by selecting the field in the in-place editor and accessing the Format String editor via the control’s smart tag.
Displaying Page Numbers
Use the XRPageInfo control to display information about document pages such as the current page number and/or total number of pages.

You can use this control to add information about a report’s author and the document’s creation date.
See the following tutorials for detailed instructions:
Displaying Check Boxes, Images and Bar Codes
Dropping a Boolean data field from the Field List onto a report creates an XRCheckBox control bound to that field.

Checkboxes can display different states depending on the underlying data values.

Use the XRPictureBox control to display images in a report. You can load an image from an external file or bind this control to a binary data source field.

To display barcodes, use the XRBarCode control.

Drawing Lines and Shapes
Use the XRShape control to draw simple graphics in a report (circles, crosses or arrows).

The XRLine control enables you to draw straight or slanted lines in a single band.

The following controls enable you to draw lines and boxes spanning multiple report bands: