Providing Data to Charts
- 3 minutes to read
This topic provides the most important information you need to consider when embedding a chart into a report:
Chart Overview
The XRChart control can only be used in reports. To use similar charts elsewhere in your application, use the following controls.
| Platform | Chart Control Class | Documentation |
|---|---|---|
| ASP.NET | WebChartControl | Chart Control (ASP.NET) |
| Windows Forms | ChartControl | Chart Control (WinForms) |
| WPF | ChartControl and Chart3DControl | Charts Suite (WPF) |
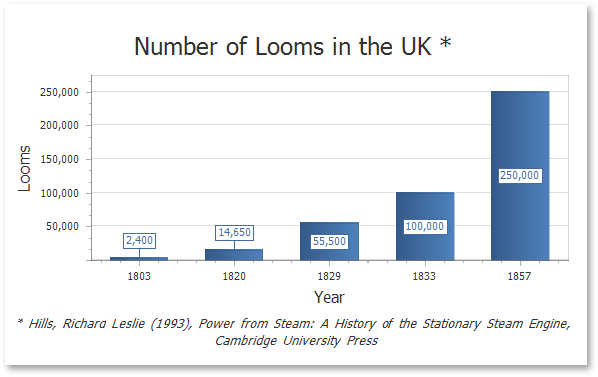
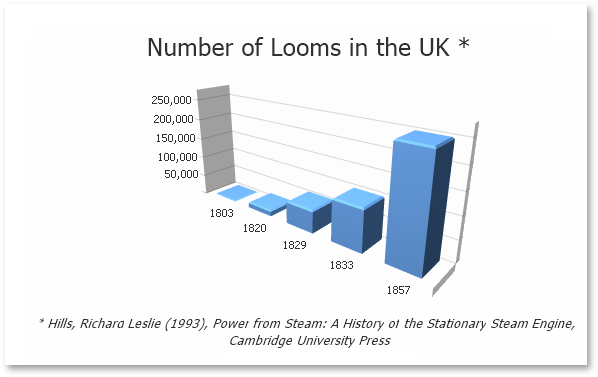
The chart enables you to visualize series of points using 2D or 3D views.
| 2D Series View | 3D Series View |
|---|---|
 |
 |
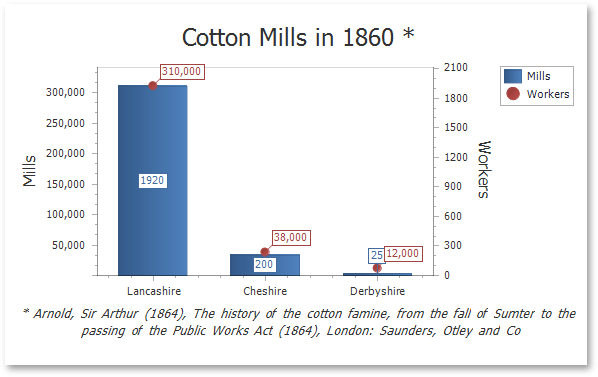
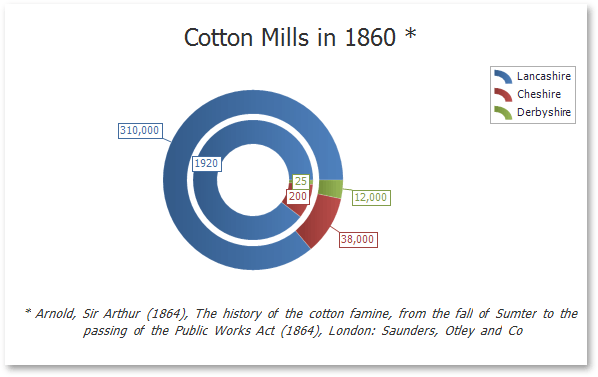
A chart can display multiple series having compatible views.
| Bar and Point Series | Nested Doughnut Series |
|---|---|
 |
 |
A chart contains various visual elements (such as diagrams, series, legends, primary and secondary axes, titles and labels). You can select these elements in the Report Designer and customize their settings in the Property Grid.
Chart Designer
The desktop and web End-User Report Designer versions provide the Chart Designer enabling your end-users to quickly create and customize charts.
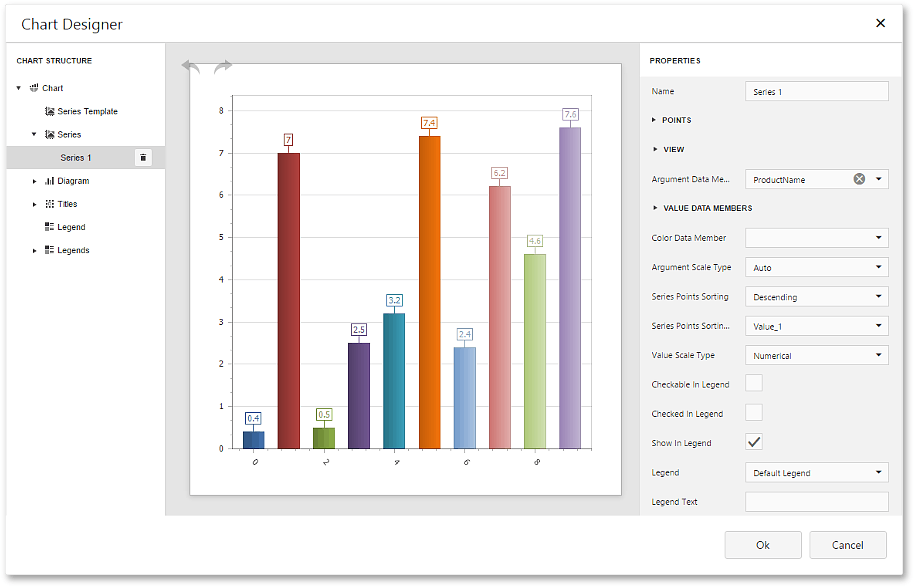
End-User Report Designer for ASP.NET
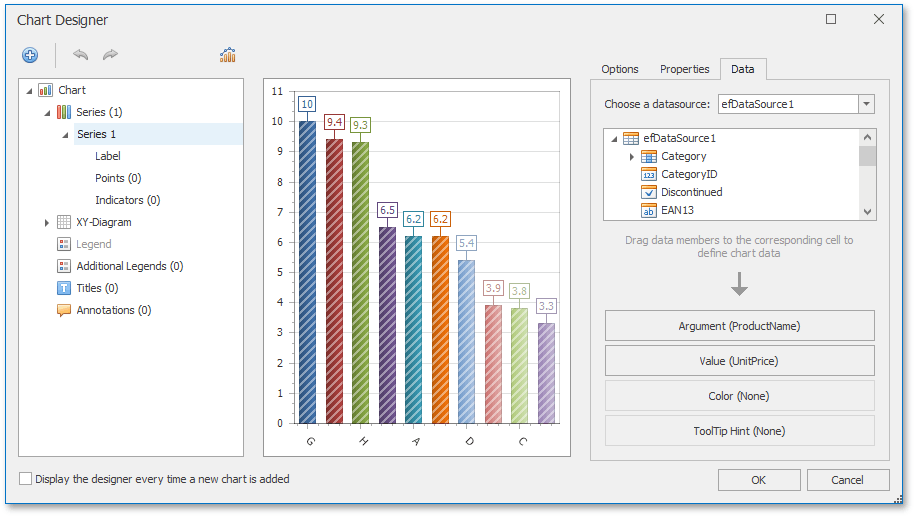
End-User Report Designer for WinForms
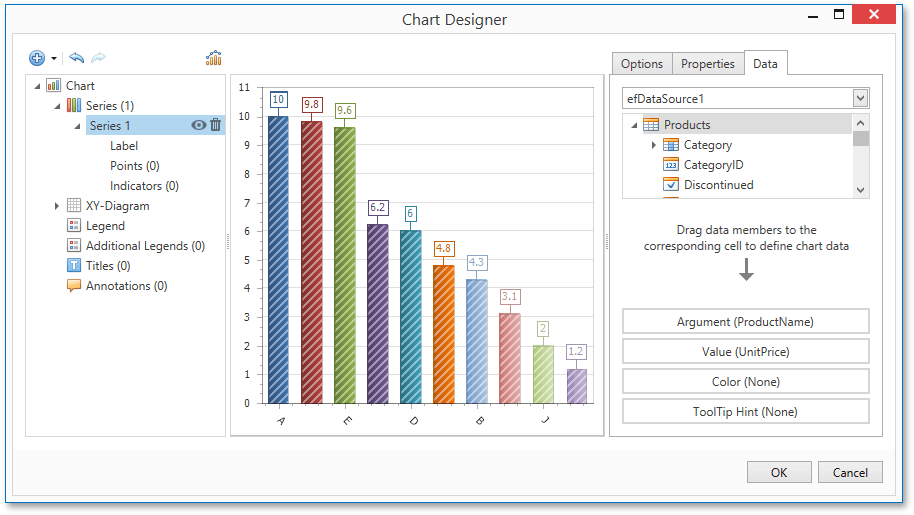
End-User Report Designer for WPF
Bind a Chart to Data
To bind a chart to data, use the XRChart.DataSource property.
You can assign a Pivot Grid to a chart’s data source, allowing the XRPivotGrid to supply data to the chart. To learn more about this feature, see Linking a Chart with a Pivot Grid.
When the chart data source is not assigned, the chart obtains data from the report’s data source (assigned to the XtraReportBase.DataSource property). A chart located in a DetailReportBand obtains its data from the detail report’s data source.
In most scenarios, you need to locate a chart on the report header/footer band to display a summary for the detail report data.
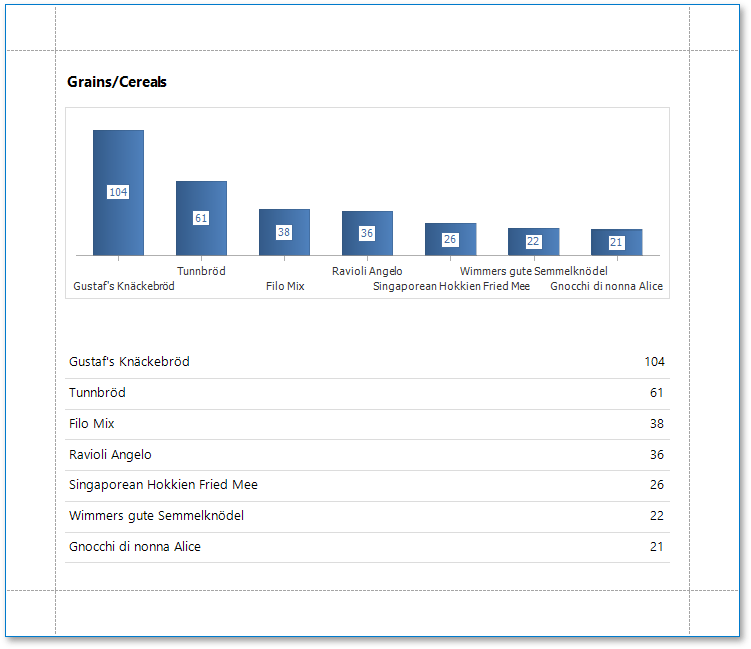
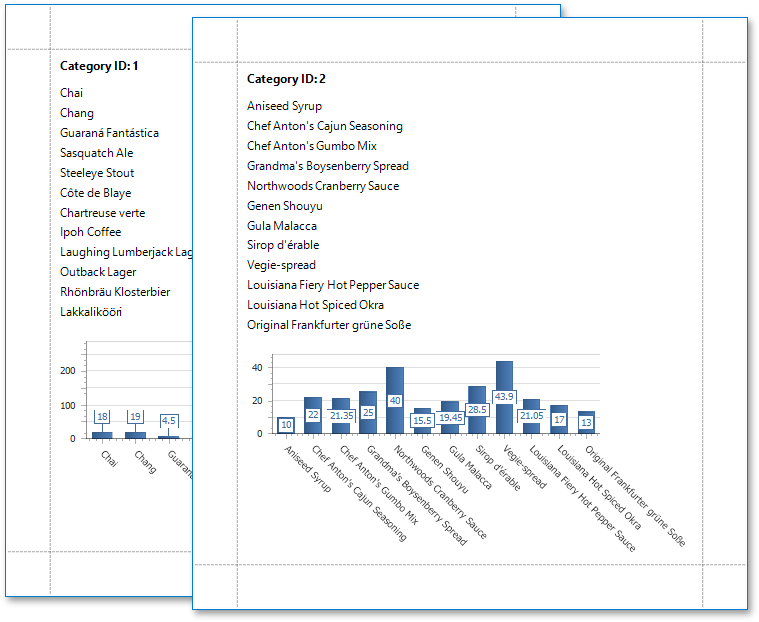
When placing a chart onto a group header/footer, use the XRDataFilter.ValueBinding property to allow the chart to visualize data in each report group. For a step-by-step tutorial, see Using Charts to Visualize Data in Report Groups.
Placing a chart onto the Detail band allows the chart to be printed as many times as there are records in the report’s data source. Consider using a custom progress bar control instead of the chart control to visualize report detail data.
To provide data to a chart’s series, specify the following settings.
- The SeriesBase.ArgumentDataMember property (specifies the data field providing point arguments).
- The SeriesBase.ValueDataMembers property (specifies the data fields supplying point values).
Depending on whether or not you create series manually, you can specify these settings in the following ways.
To bind each series individually, add new series to the chart’s XRChart.Series collection and specify the argument and value data members for each of these series.
For a step-by-step tutorial illustrating this approach, see Binding a Chart’s Series to Data.
To create series dynamically, assign the data field containing series names to the XRChart.SeriesDataMember property and specify the argument and value data members of the SeriesBase object returned by the XRChart.SeriesTemplate property.
For a step-by-step tutorial illustrating this approach, see Binding a Chart to Data Using Series Templates.
The data members assigned to the series argument and values must match the data types specified by the SeriesBase.ArgumentScaleType and SeriesBase.ValueScaleType properties.
Tip
See the WinForms Charts Documentation to learn more about using charts.