Using Charts to Visualize Data in Report Groups
- 4 minutes to read
This tutorial describes how to create groups in a report, with charts visualizing data in each of these groups. Solving this task does not require you to write any code. If however, a runtime solution is preferred, it is provided in the last section of this tutorial.
This tutorial consists of the following sections.
Group Report Data
To group data in a report, do the following.
- Open an existing reporting application or create a new one from scratch. To learn how to create a reporting application on the platform of your choice, see Adding a Report to Your .NET Application.
Bind the report to the “Products” table of a sample Northwind database (the nwind.mdb file included in the XtraReports installation).
To learn how to bind a report to a data source, see Providing Data to Reports.
Drop the “ProductName” field from the Field List onto the report’s Detail band.

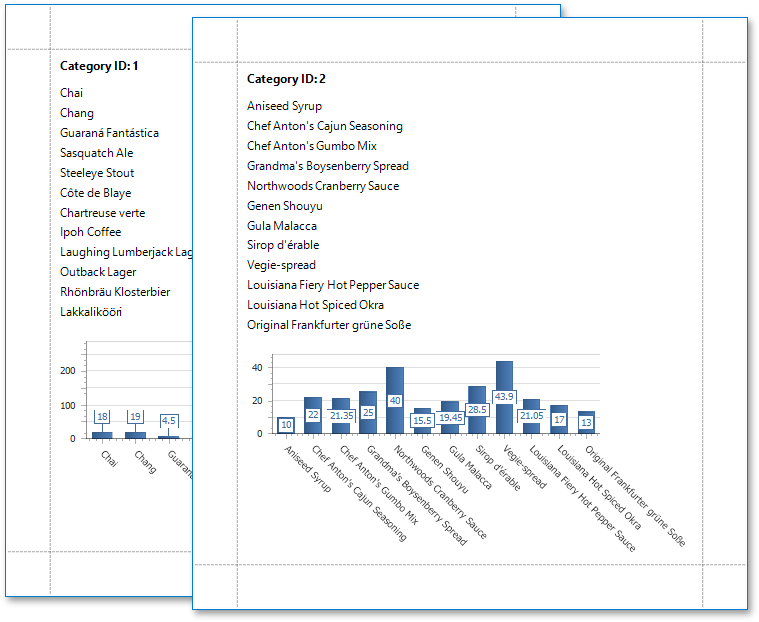
In the Group and Sort panel, click Add a Group and select grouping criteria (e.g., the “CategoryID” field).

To add a Group Footer to the report, enable the Show Footer check box.

To display group titles in the report, drop the “CategoryID” field onto the Group Header.

Create a Chart
To add a chart to the report, do the following.
Drop the XRChart control from the DX.17.2: Report Controls Toolbox tab onto the Group Footer.

After adding a chart to the report, the Chart Designer is invoked by default. If it is not, click the chart’s smart tag and select the corresponding command.

In the Chart Designer, click the plus button to add a new series…

…and select a series view.

Select the created series and switch to the Data tab.
On this tab, drop the “ProductName” field onto the Argument area and the “UnitPrice” field onto the Value area.

Switch to the Properties tab and click the ellipsis button for the DataFilters property.

In the Data Filter Collection Editor, click Add to create a new filter.
Set the filter’s ColumnName and ValueBinding properties to the “CategoryID” field that is used as grouping criteria in the report.
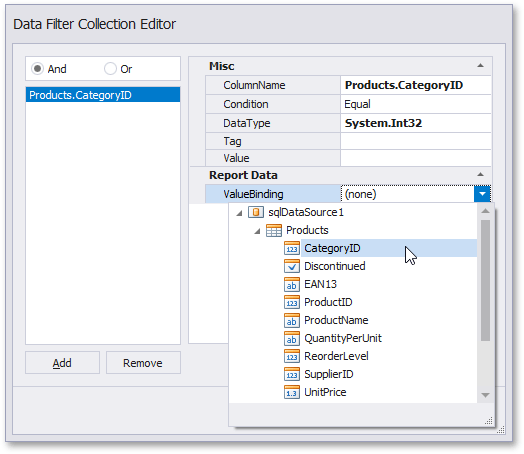
When both the Value and ValueBinding properties are specified for a data filter, only the ValueBinding setting is taken into account.
Runtime Approach
To filter a chart’s data in code, handle the XRControl.BeforePrint event of the XRChart control as follows.
private void xrChart1_BeforePrint(object sender, System.Drawing.Printing.PrintEventArgs e)
{
    XRChart xrc = (XRChart)sender;

    // Gets the current value of the grouping field.
    // For the master-detail report, use DetailBand.GetCurrentColumnValue in the detail band instead.
    string filter_value = GetCurrentColumnValue("TheGroupingField").ToString();

    // Clears the filters that may have been set earlier.
    xrc.Series[0].DataFilters.Clear();

    // Creates and adds a new filter to the "TheGroupingField" data field
    // that has the type System.String.
    // The condition is that the data value equals the filter_value parameter.
    xrc.Series[0].DataFilters.Add(new DataFilter("TheGroupingField", "System.String",
        DataFilterCondition.Equal, filter_value));
}
Several filters can be combined using either the AND or OR conjunction operator. It is specified by the DataFilterCollection.ConjunctionMode property of the DataFilterCollection object (or by the series SeriesBase.DataFiltersConjunctionMode property).
When one or more data filter objects are created for a series, the displayed series will only contain the data points that meet the filter conditions.