ChartControl.ToolTipEnabled Property
Gets or sets a value that specifies whether or not a tooltip is enabled for a chart.
Namespace: DevExpress.XtraCharts
Assembly: DevExpress.XtraCharts.v21.2.UI.dll
NuGet Packages: DevExpress.Win.Charts, DevExpress.Win.Design
Declaration
Property Value
| Type | Description |
|---|---|
| DefaultBoolean | Default - a tooltip’s state (enabled/disabled) is automatically determined according to the type of a diagram currently displayed on a chart; True - a tooltip is enabled in a chart; False - a tooltip is disabled. |
Available values:
| Name | Description |
|---|---|
| True |
|
| False |
|
| Default | The default behavior determined by the control’s logic. |
Remarks
Use the ToolTipEnabled property to activate (deactivate) a tooltip at the level of a ChartControl.
After that, it becomes possible to customize the tooltip appearance and position on a diagram via the ChartControl.ToolTipOptions property.
You can also change the tooltip content via the SeriesBase.ToolTipPointPattern property.
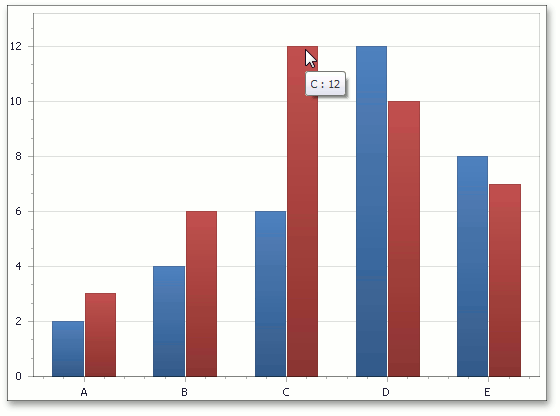
The following table shows this property in action.
| ToolTipEnabled=True | ToolTipEnabled=False |
|---|---|
 |
 |
For more information on how to use a tooltip, refer to the Tooltip topic.
How to Show and Customize Chart Tooltips
This example demonstrates how to enable and customize chart tooltips at runtime.
To enable tooltips, set the ChartControl.ToolTipEnabled property to true. For more information about chart tooltips, see the Tooltips article.
The following example shows tree series with different tooltip patterns:
unboundSeries- a simple unbound series.The series shows tooltips with the following pattern:
Line Series: {A}:{V}unboundSeriesWithTag- an unbound series with the specified SeriesPoint.Tag property for each data point.The series shows tooltips with the pattern that references
Tagvalues:{A}: {V} ({Test})boundSeries- a series that is bound to the data source.The series shows tooltips with the pattern that references data source field values:
{A}: {V} ({Comment})
using DevExpress.XtraCharts;
using System;
using System.Windows.Forms;
using DevExpress.Utils;
using System.Collections.Generic;
using System.Data;

namespace TooltipCustomization {
    public partial class Form1 : Form {
        public Form1() {
            InitializeComponent();
        }
        // Create a data source.
        public class TestChartData {
            public string Argument { get; set; }
            public double Value { get; set; }
            public string Comment { get; set; }
            public TestChartData(string arguments, double value, string comment) {
                Argument = arguments;
                Value = value;
                Comment = comment;
            }

        }
        private List<TestChartData> CreateChartData() {
            var list = new List<TestChartData>();
            list.Add(new TestChartData("A", 4, "comment for A"));
            list.Add(new TestChartData("B", 2, "comment for B"));
            list.Add(new TestChartData("C", 17, "comment for C"));
            list.Add(new TestChartData("D", 4, "comment for D"));
            list.Add(new TestChartData("E", 17, "comment for E"));
            list.Add(new TestChartData("F", 12, "comment for F"));
            list.Add(new TestChartData("G", 15, "comment for G"));
            return list;
        }

        private void Form1_Load(object sender, EventArgs e) {
            // Create an empty chart.
            ChartControl chartControl = new ChartControl();

            // Add the chart to the form.
            chartControl.Dock = DockStyle.Fill;
            this.Controls.Add(chartControl);

            // Create a series and add points to it.
            Series boundSeries = new Series("Bound Series", ViewType.Line);
            // Assign the created data source to the series.
            boundSeries.DataSource = CreateChartData();
            boundSeries.ArgumentScaleType = ScaleType.Auto;
            boundSeries.ArgumentDataMember = "Argument";
            boundSeries.ValueScaleType = ScaleType.Numerical;
            boundSeries.ValueDataMembers.AddRange(new string[] { "Value" });

            Series unboundSeries = new Series("Unbound Series", ViewType.Line);
            unboundSeries.Points.Add(new SeriesPoint("A", new double[] { 9 }));
            unboundSeries.Points.Add(new SeriesPoint("B", new double[] { 7 }));
            unboundSeries.Points.Add(new SeriesPoint("C", new double[] { 23 }));
            unboundSeries.Points.Add(new SeriesPoint("D", new double[] { 9 }));
            unboundSeries.Points.Add(new SeriesPoint("E", new double[] { 23 }));
            unboundSeries.Points.Add(new SeriesPoint("F", new double[] { 17 }));
            unboundSeries.Points.Add(new SeriesPoint("G", new double[] { 20 }));

            Series unboundSeriesWithTag = new Series("Unbound Series with Tag", ViewType.Line);
            unboundSeriesWithTag.Points.Add(new SeriesPoint("A", 2) { Tag = new { Test = "TestValue" } });
            unboundSeriesWithTag.Points.Add(new SeriesPoint("B", 0) { Tag = new { Test = "TestValue" } });
            unboundSeriesWithTag.Points.Add(new SeriesPoint("C", 15) { Tag = new { Test = "TestValue" } });
            unboundSeriesWithTag.Points.Add(new SeriesPoint("D", 2) { Tag = new { Test = "TestValue" } });
            unboundSeriesWithTag.Points.Add(new SeriesPoint("E", 15) { Tag = new { Test = "TestValue" } });
            unboundSeriesWithTag.Points.Add(new SeriesPoint("F", 10) { Tag = new { Test = "TestValue" } });
            unboundSeriesWithTag.Points.Add(new SeriesPoint("G", 13) { Tag = new { Test = "TestValue" } });

            // Add the series to the chart.
            chartControl.Series.AddRange(unboundSeries, unboundSeriesWithTag, boundSeries);
            // Enable data point markers.
            ((LineSeriesView)unboundSeries.View).MarkerVisibility = DefaultBoolean.True;
            ((LineSeriesView)unboundSeriesWithTag.View).MarkerVisibility = DefaultBoolean.True;
            ((LineSeriesView)boundSeries.View).MarkerVisibility = DefaultBoolean.True;
            // Disable a crosshair cursor.
            chartControl.CrosshairEnabled = DefaultBoolean.False;

            // Enable chart tooltips.
            chartControl.ToolTipEnabled = DefaultBoolean.True;

            // Show a tooltip's beak.
            ToolTipController controller = new ToolTipController();
            chartControl.ToolTipController = controller;
            controller.ShowBeak = true;

            // Change the default tooltip mouse position to relative position.
            ToolTipRelativePosition relativePosition = new ToolTipRelativePosition();
            chartControl.ToolTipOptions.ToolTipPosition = relativePosition;

            // Specify the tooltip relative position offsets.
            relativePosition.OffsetX = 2;
            relativePosition.OffsetY = 2;

            // Specify the tooltip point pattern.
            unboundSeries.ToolTipPointPattern = "Line Series: {A}:{V}";
            unboundSeriesWithTag.ToolTipPointPattern = "{A}: {V} ({Test})";
            boundSeries.ToolTipPointPattern = "{A}: {V} ({Comment})";
        }
    }
}