ChartControl.PaletteBaseColorNumber Property
Gets or sets the number of a color within the selected palette, which will be used as a base color to paint series points.
Namespace: DevExpress.XtraCharts
Assembly: DevExpress.XtraCharts.v21.2.UI.dll
NuGet Packages: DevExpress.Win.Charts, DevExpress.Win.Design
Declaration
Property Value
| Type | Description |
|---|---|
| Int32 | An integer value representing a 1-based color number. |
Remarks
The following pictures illustrate how the PaletteBaseColorNumber property works. Note that when the PaletteBaseColorNumber property is set to 0, and the SeriesViewColorEachSupportBase.ColorEach property of a series is set to true, a palette’s colors are used to paint individual points of that series.
| PaletteBaseColorNumber = 0 | PaletteBaseColorNumber = 1 | PaletteBaseColorNumber = 3 |
|---|---|---|
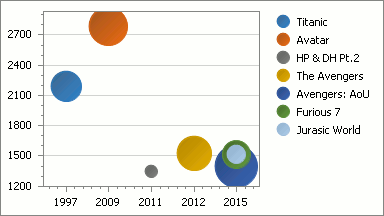 |
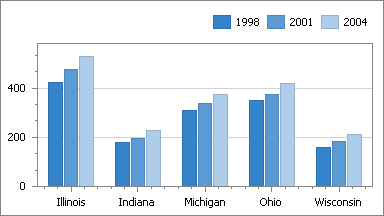 |
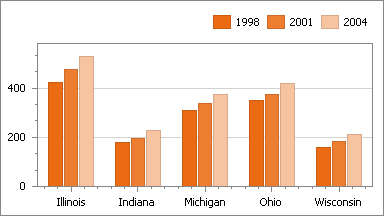 |
Example
This example demonstrates how to customize a chart’s appearance at runtime, via the ChartControl.AppearanceName, ChartControl.PaletteName and ChartControl.PaletteBaseColorNumber properties.
Note that you can define a separate palette for painting all indicators available in your chart, via the ChartControl.IndicatorsPaletteName property.
using System;
using System.Windows.Forms;
using DevExpress.XtraCharts;
// ...
private void Form1_Load(object sender, EventArgs e) {
    // Create an empty chart.
    ChartControl barChart = new ChartControl();

    // Create a series and add points to it.
    Series series1 = new Series("Bar Series", ViewType.Bar);
    series1.Points.Add(new SeriesPoint("A", new double[] { 10 }));
    series1.Points.Add(new SeriesPoint("B", new double[] { 12 }));
    series1.Points.Add(new SeriesPoint("C", new double[] { 14 }));
    series1.Points.Add(new SeriesPoint("D", new double[] { 17 }));

    // Create an indicator (e.g. Regression Line),
    // and add it to the series' collection.
    RegressionLine myLine = new RegressionLine(ValueLevel.Value);
    ((SideBySideBarSeriesView)series1.View).Indicators.Add(myLine);

    // Add the series to the chart.
    barChart.Series.Add(series1);

    // Define the chart's appearance and palette.
    barChart.AppearanceName = "Dark";
    barChart.PaletteName = "Opulent";
    barChart.PaletteBaseColorNumber = 5;

    // Define a separate palette for the chart's indicators.
    barChart.IndicatorsPaletteName = "Default";

    // Add the chart to the form.
    barChart.Dock = DockStyle.Fill;
    this.Controls.Add(barChart);
}