Pivot Charting (Integration with a Pivot Grid Control)
- 6 minutes to read
This document describes the capability to automatically bridge (link) a chart with a Pivot Grid, lists the auto-defined options that are set after this link, and describes event handlers for manual customizations.
This document consists of the following sections.
Feature Overview
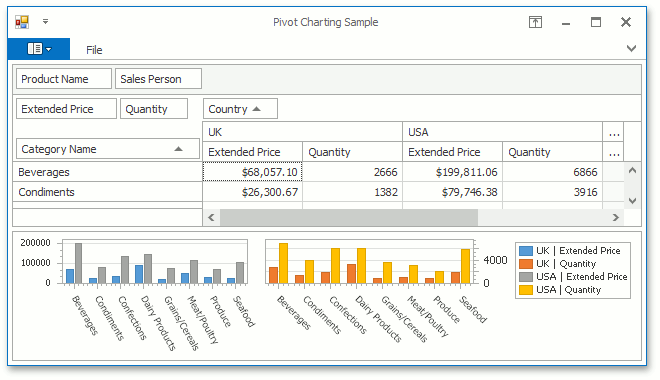
Both the WinForms Chart Control and PivotGridControl are well adapted to pair with each other in your application. While each control provides a specific set of related options, they also share some common properties between controls. This allows you to easily deploy the two as a bundle (or, a Pivot Chart), by simply specifying a Pivot Grid as a chart’s data source.
To learn how to bind a Chart control with a Pivot Grid, see the Integration with the Chart Control topic.
A similar functionality is available for bridging the XRChart with the XRPivotGrid.
A Pivot Grid’s data is auto-retrieved by a chart, after assigning a PivotGridControl instance to the ChartControl.DataSource property.
You can vary the layout of the incoming data, using the options listed in the following section: The Data Source Options.
In addition, after specifying a Pivot Grid instance as a chart’s data source, the following two properties automatically adjust this bridge: PivotGridDataSourceOptions.AutoBindingSettingsEnabled and PivotGridDataSourceOptions.AutoLayoutSettingsEnabled. To access the PivotGridDataSourceOptions object, use the ChartControl.PivotGridDataSourceOptions property. If required, each of the settings that are affected by these automatic options can be tweaked in the corresponding event handler. This is detailed in the following section: The Automatic Settings.
The Data Source Options
A PivotGridDataSourceOptions object returned by the ChartControl.PivotGridDataSourceOptions property contains settings that determine the common behavior for a bridged chart and Pivot Grid pair. This property is linked to the PivotGridControl.OptionsChartDataSource property of the associated Pivot Grid, and changing any of its options is synchronous for the associated control.
These settings are listed in the table below.
| Function | Member | Description |
|---|---|---|
| Format of the incoming data | PivotGridDataSourceOptions.RetrieveDataByColumns | Specifies whether or not a Chart’s series are created based on columns or rows of its associated Pivot Grid. |
| PivotGridDataSourceOptions.RetrieveEmptyCells | Specifies whether or not empty cells should be passed to a Chart from its associated Pivot Grid. | |
| Treatment of pivot totals | PivotGridDataSourceOptions.RetrieveColumnCustomTotals | Specifies whether or not column custom totals should be passed to a Chart from its associated Pivot Grid. |
| PivotGridDataSourceOptions.RetrieveColumnGrandTotals | Specifies whether or not column grand totals should be passed to a Chart from its associated Pivot Grid. | |
| PivotGridDataSourceOptions.RetrieveColumnTotals | Specifies whether or not column totals should be passed to a Chart from its associated Pivot Grid. | |
| PivotGridDataSourceOptions.RetrieveRowCustomTotals | Specifies whether or not row custom totals should be passed to a Chart from its associated Pivot Grid. | |
| PivotGridDataSourceOptions.RetrieveRowGrandTotals | Specifies whether or not row grand totals should be passed to a Chart from its associated Pivot Grid. | |
| PivotGridDataSourceOptions.RetrieveRowTotals | Specifies whether or not row totals should be passed to a Chart from its associated Pivot Grid. | |
| Limiting of the number of series and points | PivotGridDataSourceOptions.MaxAllowedPointCountInSeries | Limits the number of incoming points in a Chart’s series that are auto-created, based on the associated Pivot Grid. |
| PivotGridDataSourceOptions.MaxAllowedSeriesCount | Limits the number of a Chart’s series that are auto-created, based on the associated Pivot Grid. | |
| Additional options | PivotGridDataSourceOptions.SelectionOnly | Specifies whether or not only the currently selected cells of a Pivot Grid are reflected in its associated Chart. |
| PivotGridDataSourceOptions.UpdateDelay | Specifies the delay (in milliseconds) that occurs before passing the changes made in a Pivot Grid to its associated Chart. |
The Automatic Settings
Automatic Binding Settings
The PivotGridDataSourceOptions.AutoBindingSettingsEnabled property automatically adjusts the following options.
- ChartControl.SeriesDataMember;
- the series template‘s SeriesBase.ArgumentDataMember, SeriesBase.ValueDataMembers, SeriesBase.ArgumentScaleType and SeriesBase.ValueScaleType.
To modify these settings, handle the ChartControl.CustomizeAutoBindingSettings event, raised after applying them.
Automatic Layout Settings
The ChartControl.AutoLayoutSettingsEnabled property automatically adjusts the chart’s layout differently for two main diagram types.
-
If the argument scale type is date-time, the DateTimeScaleOptions.MeasureUnit and DateTimeScaleOptions.GridAlignment properties of the X-axis are set to the minimum measurement unit of the data points.
Similar to these settings, the DateTimeOptions.Format and DateTimeOptions.FormatString properties are set.
And, if arguments have different date time measurement units (e.g. years and months), scale breaks (with the ScaleBreakOptions.Style set to Straight, and ScaleBreakOptions.SizeInPixels set to -1) are inserted into the X-axis’ range. This hides the empty space that occurs between data points (e.g. a yearly point in a monthly scale has 11 empty months before the next point appears, and a scale break would hide this space).
Note
After applying these settings, the ChartControl.BoundDataChanged event is raised.
The X-axis labels‘ text is affected by the measurement unit setting (like year, month, or day), and superfluous labels are hidden.
The AxisLabel.Staggered property is enabled, if the axis scale type is Qualitative or DateTime (except for Year), and the label direction is parallel to that of the axis (for example, the AxisLabel.Angle is 0 when the diagram is not rotated, and 90 when the it is).
Note
After setting the X-axis’ AxisLabel.Staggered property, the ChartControl.PivotChartingCustomizeXAxisLabels event is raised.
-
For a Simple diagram, the legend is visible only if the chart has a single auto-created series, or if the number of points in all auto-created series is equal, and one or more series contain all (not empty) points from another series (only this series will appear in the legend).
For the SeriesBase.LegendTextPattern property of the auto-created series, the PointOptions.PointView is set to Argument. If the legend is visible, the PointOptions.PointView of the SeriesLabelBase.TextPattern property of each auto-created series is set to Values or ArgumentAndValues. For the Pie and Doughnut series, the PieSeriesLabel.Position is set to TwoColumns. And, each auto-created series is accompanied by a title, with its Title.Text set to the series name.
Note
After applying these settings, the ChartControl.BoundDataChanged event is raised.
For series labels of both diagram types, the SeriesLabelBase.ResolveOverlappingMode is set to Default (if possible), or to HideOverlapped (when the labels count is too large for the current diagram size).
Note
Before updating this property, the ChartControl.CustomizeResolveOverlappingMode event is raised.
Finally, the Legend.MaxHorizontalPercentage and the Legend.MaxVerticalPercentage properties of the chart’s legend are automatically set to best fit.
Note
Before updating the above properties, the ChartControl.CustomizeLegend event is raised.