Data Points
A Series Data Point represents an individual data point within a series. A data point is represented by the PointData class.
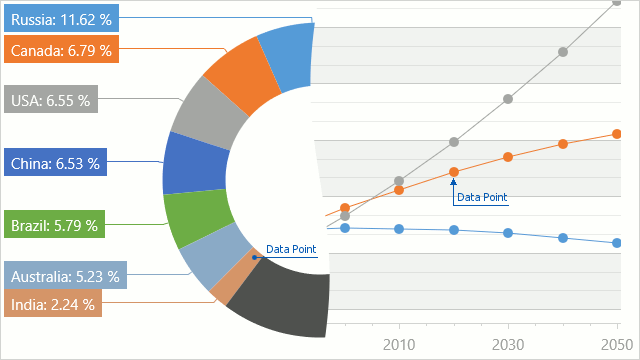
Each data point is plotted on the chart area, based upon one X value (the point’s argument) and one or more Y values (the value(s) of the data point). Depending on the view type of the series that owns the point, the point can be represented within the chart with the help of different chart elements (such as a bar, a data point marker or a pie slice) and can be identified using data point labels.