Lesson 2 - Create a Vector Map
- 4 minutes to read
This is the second tutorial of the Map Control Getting Started series. It will guide you through the process of creating a map application with vector items loaded from an external Vector Format Files.
This tutorial consists of the following steps.
- Step 1. Add a Map Control
- Step 2. Load Shapes from a Shapefile
- Step 3. Colorize Shapes
- Step 4. Add a Color Legend
- Result
Step 1. Add a Map Control
To add a Map control to the application, Run MS Visual Studio 2017, create a new Universal | Blank App (Windows Universal) project and add the MapControl component to your project as you did in Lesson 1.
After this, your XAML should look as follows. If it does not, you can overwrite your code with:
<Page xmlns:Map="using:DevExpress.UI.Xaml.Map"
    x:Class="MapLesson2.MainPage"
    xmlns="http://schemas.microsoft.com/winfx/2006/xaml/presentation"
    xmlns:x="http://schemas.microsoft.com/winfx/2006/xaml"
    xmlns:local="using:MapLesson2"
    xmlns:d="http://schemas.microsoft.com/expression/blend/2008"
    xmlns:mc="http://schemas.openxmlformats.org/markup-compatibility/2006"
    mc:Ignorable="d">

    <Grid Background="{ThemeResource ApplicationPageBackgroundThemeBrush}">
        <Map:MapControl/>
    </Grid>
</Page>
Step 2. Load Shapes from a Shapefile
Shape data can be stored in numerous existing data formats. The Map control supports loading data from Shapefile and KML file formats. For this lesson, we can use one of the Shapefiles that are shipped with the DevExpress Map Control‘s demo. By default, these files are installed in the following folder.
C:\Users\Public\Documents\DevExpress Demos 19.2\Universal App ControlsFeatureDemo\CS\FeatureDemo\MapDemo\Data\Shapefiles\
To load data from a Shapefile, do the following.
Copy the Countries.shp and Countries.dbf files to the Assets directory of your project and include these files in your solution.
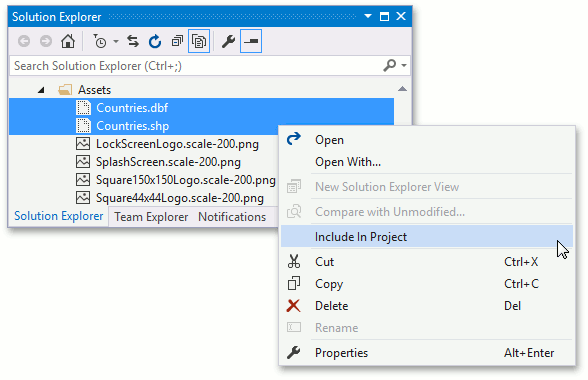
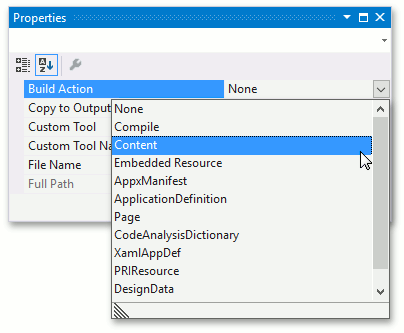
For both files, set the Build Action property to Content.
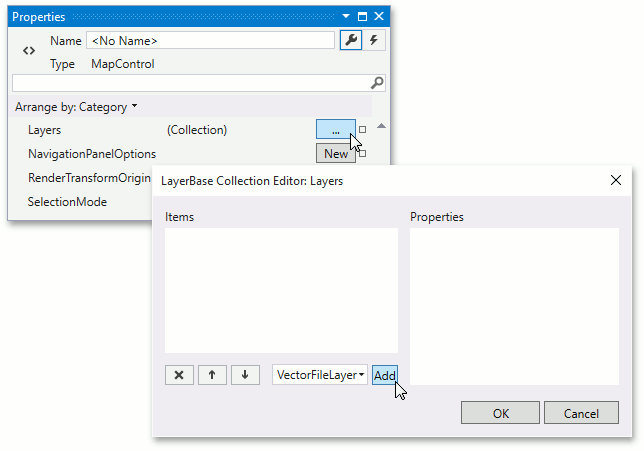
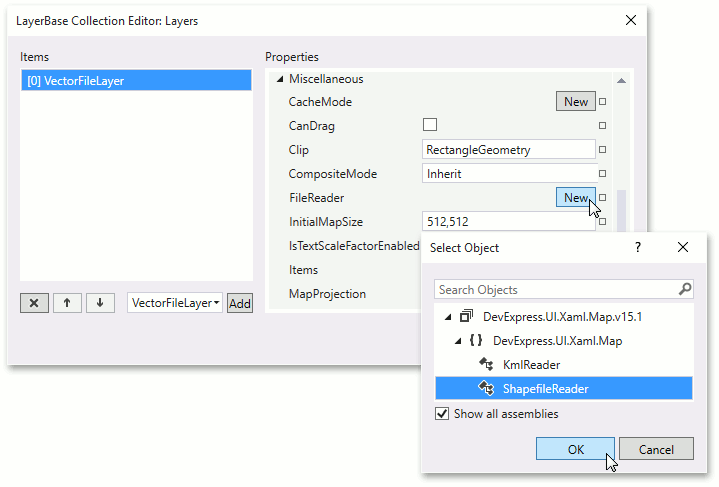
In the Properties window, locate the MapControl.Layers property, click the ellipsis button. In the invoked window, add a VectorFileLayer object to the collection.
For the added VectorFileLayer object, assign a ShapefileReader object to the VectorFileLayer.FileReader property.
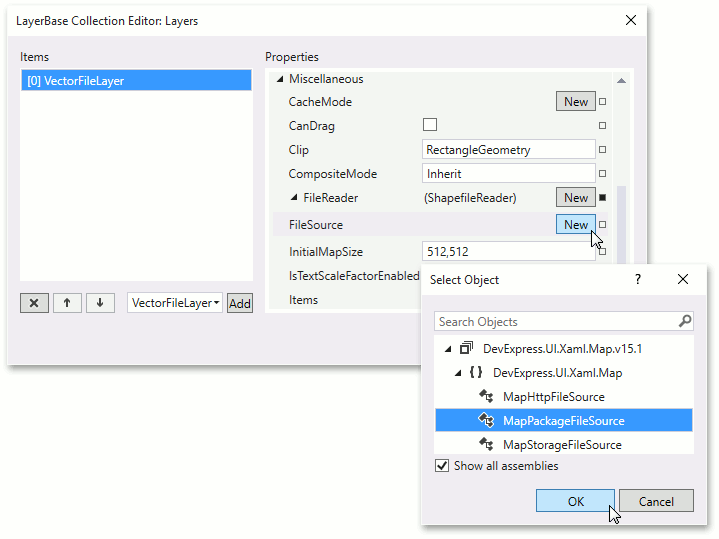
Assign a MapPackageFileSource object to the MapFileReaderBase.FileSource property.
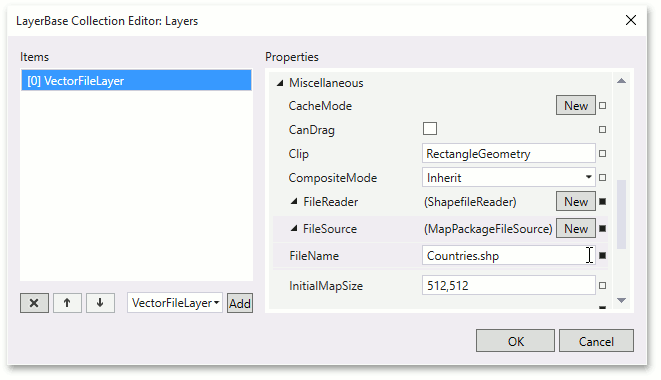
Set the MapPackageFileSource.FileName property value to Data\Countries.shp.
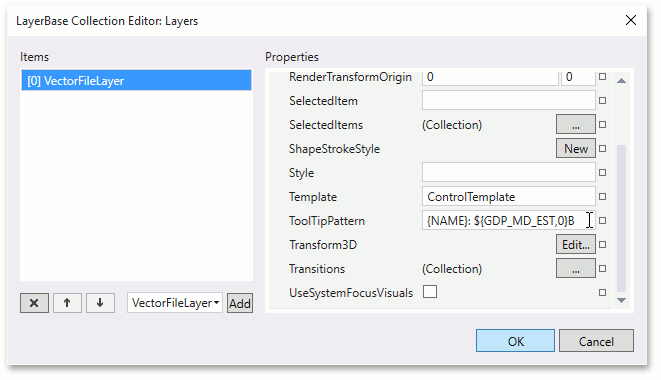
Set the MapItemsLayerBase.ToolTipPattern property to {NAME}: ${GDP_MD_EST}M.
Then click OK to close the window and execute the changes.
After performing these steps, your XAML should look like this.
<Page xmlns:Map="using:DevExpress.UI.Xaml.Map"
    x:Class="MapControl_Lesson2.MainPage"
    xmlns="http://schemas.microsoft.com/winfx/2006/xaml/presentation"
    xmlns:x="http://schemas.microsoft.com/winfx/2006/xaml"
    xmlns:d="http://schemas.microsoft.com/expression/blend/2008"
    xmlns:mc="http://schemas.openxmlformats.org/markup-compatibility/2006"
    xmlns:local="using:MapControl_Lesson2"
    mc:Ignorable="d">

    <Grid Background="{ThemeResource ApplicationPageBackgroundThemeBrush}">
        <Map:MapControl>
            <Map:VectorFileLayer ToolTipPattern="{}{NAME}: ${GDP_MD_EST}M">
                <Map:ShapefileReader>
                    <Map:MapPackageFileSource FileName="Countries.shp"/>
                </Map:ShapefileReader>
            </Map:VectorFileLayer>
        </Map:MapControl>
    </Grid>
</Page>
Step 3. Colorize Shapes
Loaded country shapes can be colorized to represent, for example, a political or statistical map. To colorize data, do the following.
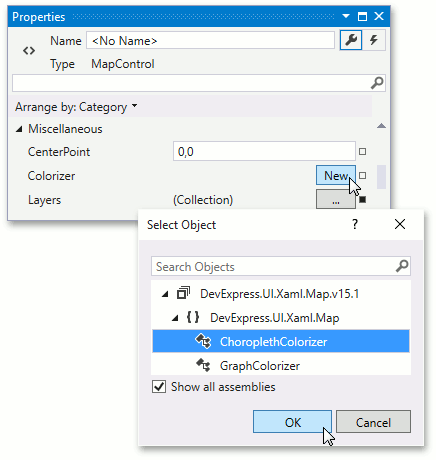
Create a ChoroplethColorizer object and assign it to the MapControl.Colorizer property.
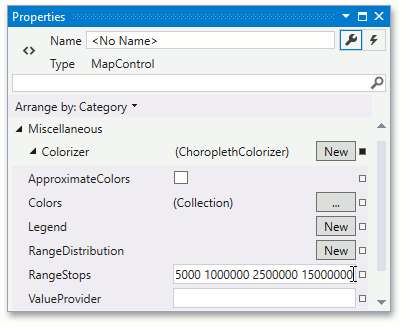
Set the ChoroplethColorizer.RangeStops collection value to 0 3000 10000 18000 28000 44000 82000 185000 1000000 2500000 15000000.
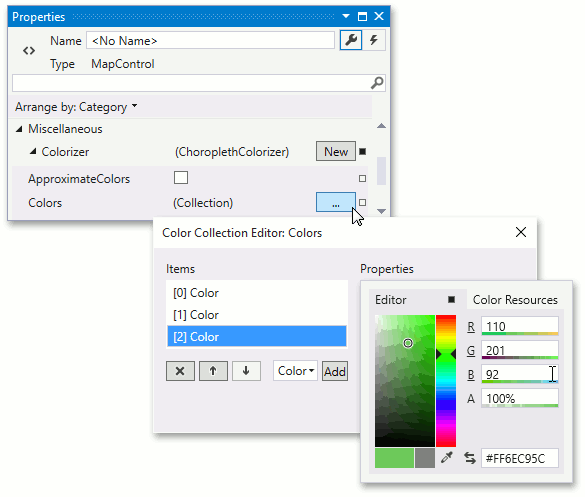
Specify the MapColorizer.Colors collection. For this, locate the property and click the ellipsis button. In the invoked window, add the following list of colors.
- R=255, G=90, B=25
- R=229, G=227, B=53
- R=110, G=201, B=92
- Assign a ShapeAttributeValueProvider object to the ChoroplethColorizer.ValueProvider property. Set the ShapeAttributeValueProvider.AttributeName property value to GDP_MD_EST.
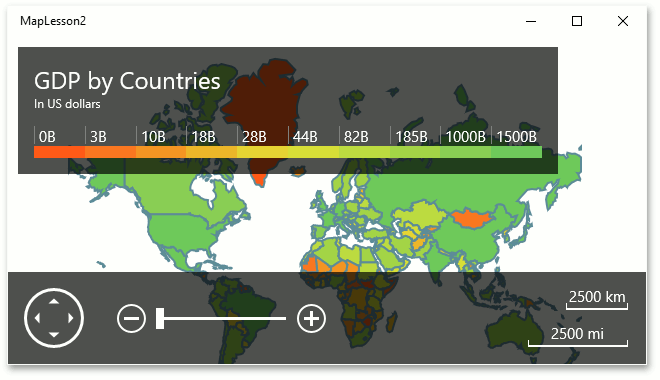
If you run the application now, it should look as follows.
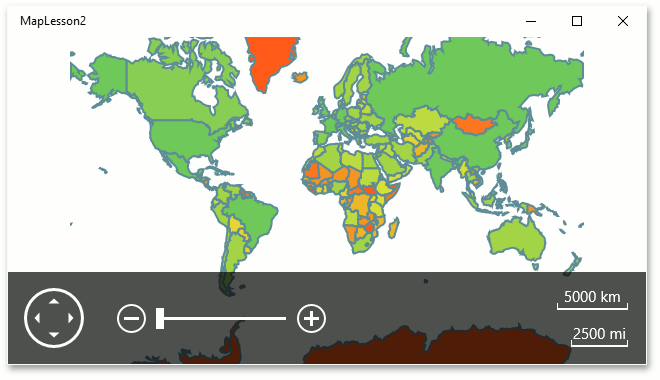
Right now, it is hard to determine which color belongs to which value range. To solve this problem, add a color legend.
Step 4. Add a Color Legend
Do this as follows:.
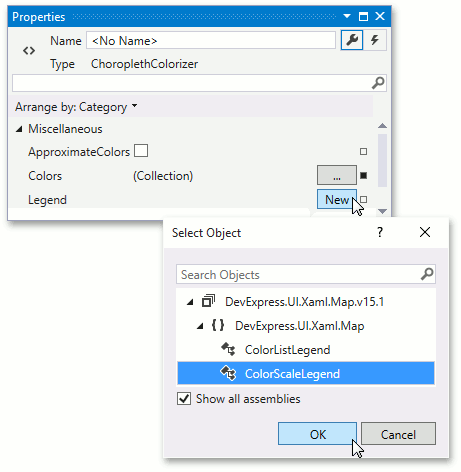
Assign a ColorScaleLegend object to the ChoroplethColorizer.Legend property.
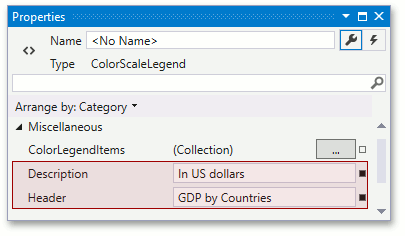
Set the ColorScaleLegend.Header to GDP by Countries and the ColorScaleLegend.Description to In US dollars.
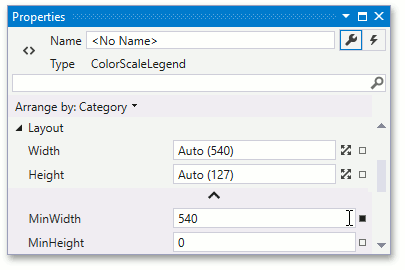
Set the MinWidth property of the legend to 550.
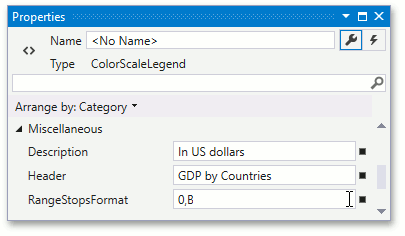
Set the ColorLegend.RangeStopsFormat property value to 0,B.
Result
The application code should look as follows.
<Page xmlns:Map="using:DevExpress.UI.Xaml.Map"
      x:Class="MapLesson2.MainPage"
      xmlns="http://schemas.microsoft.com/winfx/2006/xaml/presentation"
      xmlns:x="http://schemas.microsoft.com/winfx/2006/xaml">

    <Grid>
        <Map:MapControl Background="{ThemeResource ApplicationPageBackgroundThemeBrush}">
            <Map:MapControl.NavigationPanelOptions>
                <Map:NavigationPanelOptions ShowCoordinates="False"/>
            </Map:MapControl.NavigationPanelOptions>
            <Map:MapControl.Colorizer>
                <Map:ChoroplethColorizer RangeStops="0 3000 10000 18000 28000 44000 82000 185000 1000000 2500000 1500000">
                    <Map:ChoroplethColorizer.Colors>
                        <Color>#FFFF5A19</Color>
                        <Color>#FFE5E335</Color>
                        <Color>#FF6EC95C</Color>
                    </Map:ChoroplethColorizer.Colors>
                    <Map:ChoroplethColorizer.Legend>
                        <Map:ColorScaleLegend Header="GDP by Countries"
                                              Description="In US dollars"
                                              RangeStopsFormat="0,B"
                                              MinWidth="540"/>
                    </Map:ChoroplethColorizer.Legend>
                    <Map:ChoroplethColorizer.ValueProvider>
                        <Map:ShapeAttributeValueProvider AttributeName="GDP_MD_EST"/>
                    </Map:ChoroplethColorizer.ValueProvider>
                </Map:ChoroplethColorizer>
            </Map:MapControl.Colorizer>
            <Map:VectorFileLayer
                ToolTipPattern="{}{NAME}: ${GDP_MD_EST:0,B}">
                <Map:ShapefileReader>
                    <Map:ShapefileReader.FileSource>
                        <Map:MapPackageFileSource FileName="Assets\Countries.shp"/>
                    </Map:ShapefileReader.FileSource>
                </Map:ShapefileReader>
            </Map:VectorFileLayer>
        </Map:MapControl>
    </Grid>
</Page>
Run application to see the result.