Full-Stacked Area
The Full-Stacked Area series (100% Stacked Area series) displays data as areas on a diagram, so that the value of each data point is stacked with all the other corresponding data points’ values. In this instance, the height of the area is always the full height of the chart diagram (i.e. 1). This representation is useful for comparing the percentage values of several series for the same point arguments.
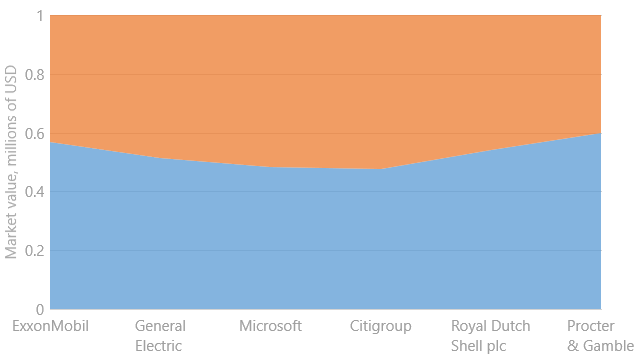
An example of the Full-Stacked Area chart is shown in the image below.