Area
The Area series displays data as filled areas on a diagram, with each data point displayed as a peak or hollow in the area. This representation is useful when you need to show trends for several series on the same diagram, and also show the relationship of the parts to the whole.
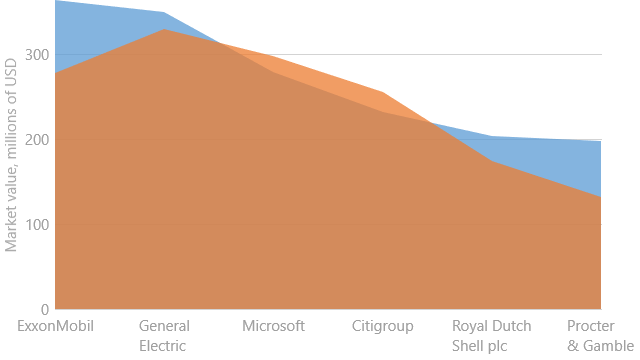
An example of the Area chart is shown in the image below.